As far back as early November we've been suggesting crude oil prices were in a bullish mode, and mood.... saying so at a point in time when being bullish on oil was not only not en vogue, but when many traders (professional and amateur alike) were convinced the commodity was due for another setback. Since then, crude oil price have gained 6.5%... a huge move by oil standards.
Yet, in light of the action that's unfurled since the middle of last month, we may be on the verge of another bullish leg for crude. This one has the potential to take oil to and even beyond the $60 threshold.
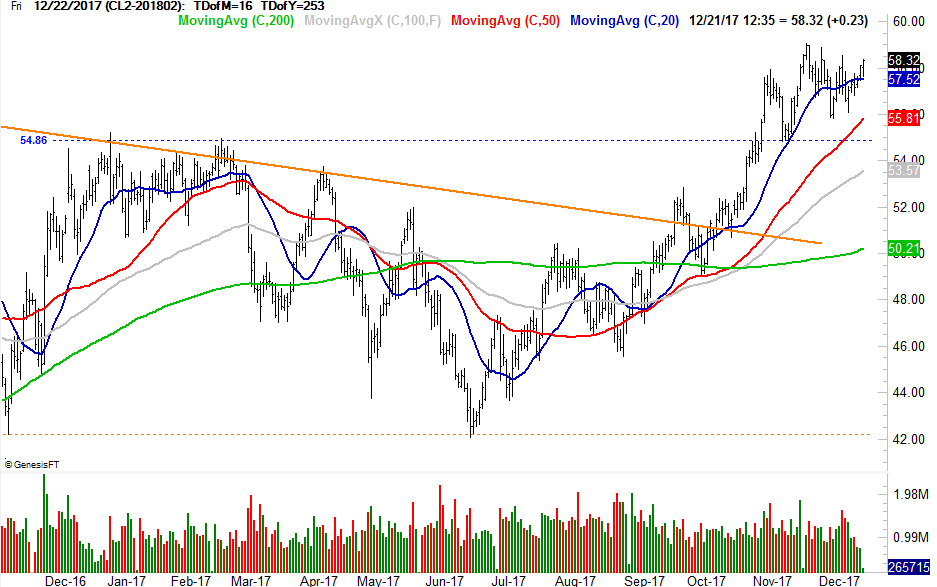
Take a look at the near-term daily chart of crude below. The former ceiling at $54.86 has since become a floor, prodding a move to higher highs and higher lows.
Yes, it's been a back-and-forth matter for the better part of this month, though the bullish undertow has become more apparent today and yesterday. But, the recent gyrations themselves are bullish in a sense. This consolidation phase between $55.80 and $58.60 (give or take) is a way for the buyers to regroup, lay down a technical base, and then use that base as a pushoff point.
We have to zoom out to a long-term daily chart of crude oil to fully appreciate where this consolidation phase fits in. Crude has been in an uptrend since early 2016. It's just been in fits and starts. The undertow is clearly pointed upward though, framed by a rising converging wedge. The upper edge of that triangle pattern is just a hair below $60, and may be at $60 by the time it's tested.
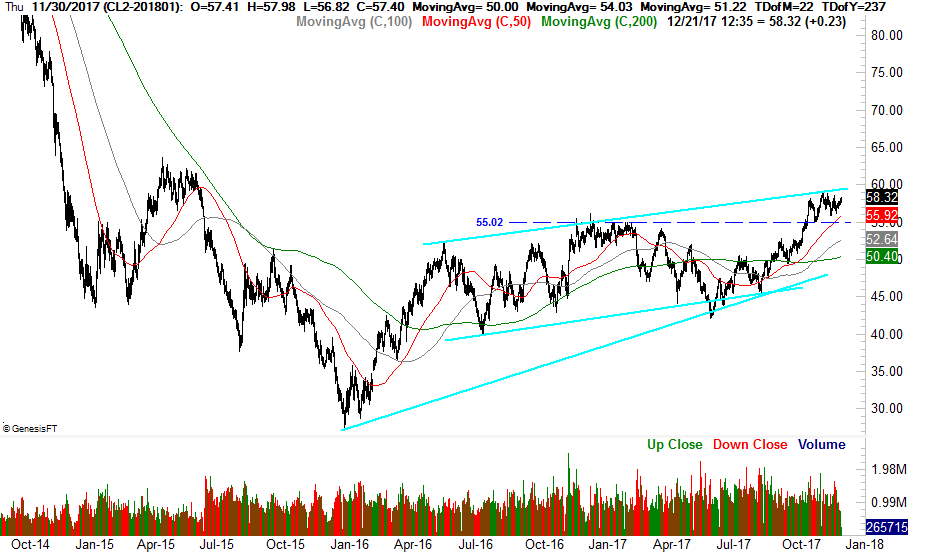
What happens if-and-when crude reaches the upper boundary is going to be critical to oil's long-term trend. If history repeats itself, crude oil prices will retreat back to the lower boundary of the edge shape. Given the momentum in place though, there's a decent chance crude could break above that ceiling. That's when it would really start to run, unleashing years worth of pent-up trading that's been kept in check by the aforementioned wedge shape.
The oil bears have generally argued that between the U.S. energy industry's lack of restraint coupled with OPEC's lack of restraint, the problem of overproduction is forever going to keep oil price suppressed. That's not an argument that holds nearly as much water as it used to, however.
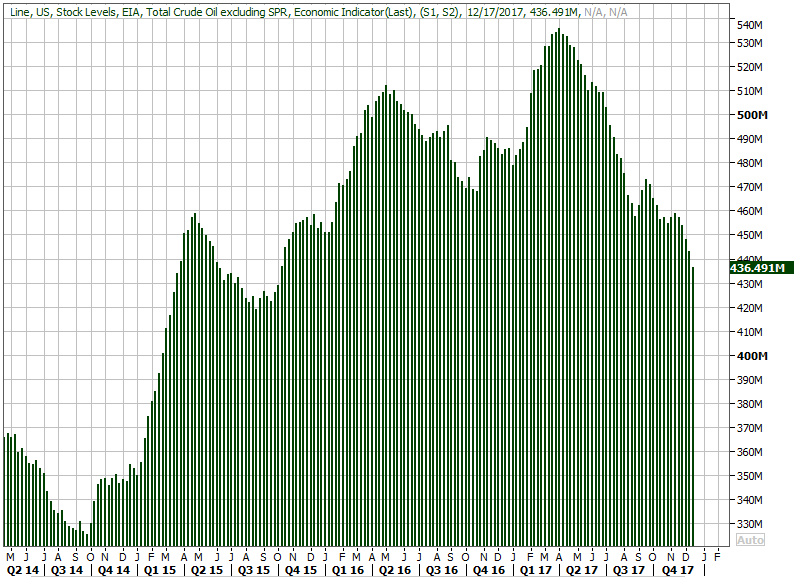
The graphic below tells the tale. After years of excessive production thanks to an explosion of fracking operation, the excess production capacity has finally been wrung out. The nation's stockpiled oil levels are now in a freefall now that the last of the overproduced crude is being consumed. The 436.5 million barrels presently in storage is the least we've seen since late 2015... when the glut went from bad to worse.
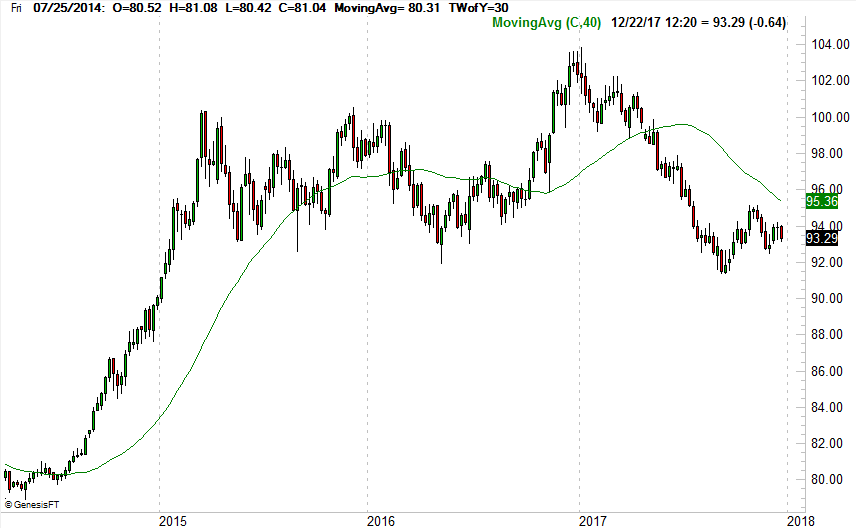
Also in play -- and working in favor of oil prices -- is the U.S. dollar.
In that crude is priced in dollars, when the greenback's value falls, the value of oil rises. And right now, the dollar is teetering on the edge of rekindling a pullback that got started in earned over the course of the first half of the current year. Should the U.S. Dollar Index fall below its November low of 92.50, oil prices could test $60 per barrel. Should the dollar index slide below the September low of 91.41, crude is apt to break past the $60 mark.
Even if the dollar doesn't lend a hand though, crude price are still working on making higher highs.
It was an idea that a unthinkable two years ago, and it's an idea many traders still doubt. Just bear in mind most people didn't think the meltdown of 2014/2015 wasn't possible either.