Crude Oil Prices Are Ready for Round Two... and This One's a Potential Game-Changer
Back in mid-September we took a close look at crude oil's price chart, pointing out how it was on the verge of a thrust above a minor technical ceiling at $50.40... though 'minor' is a relative term. In and of itself the fact that oil peaked around $50.40 a couple of times meant a move above it this time was something worth watching for - especially in light of the fact that it had paused right at that mark for a few days. It was major in the sense, however, that if crude prices were going to blast past $50.40, the bigger-picture recovery effort that had been in the works since June was likely to materialize and really heat things up.
It happened just a few days later, and a few days after that oil prices were catapulted upward.
It didn't last long, of course -- it never does. Commodity prices love and live to ebb and flow. It looks as if the profit-taking following the big surge has run its course though, with the bulls testing the waters of higher highs again.
This time, the 'second wind' move could get traction at a more sustainable pace. The chart below tells the tale.
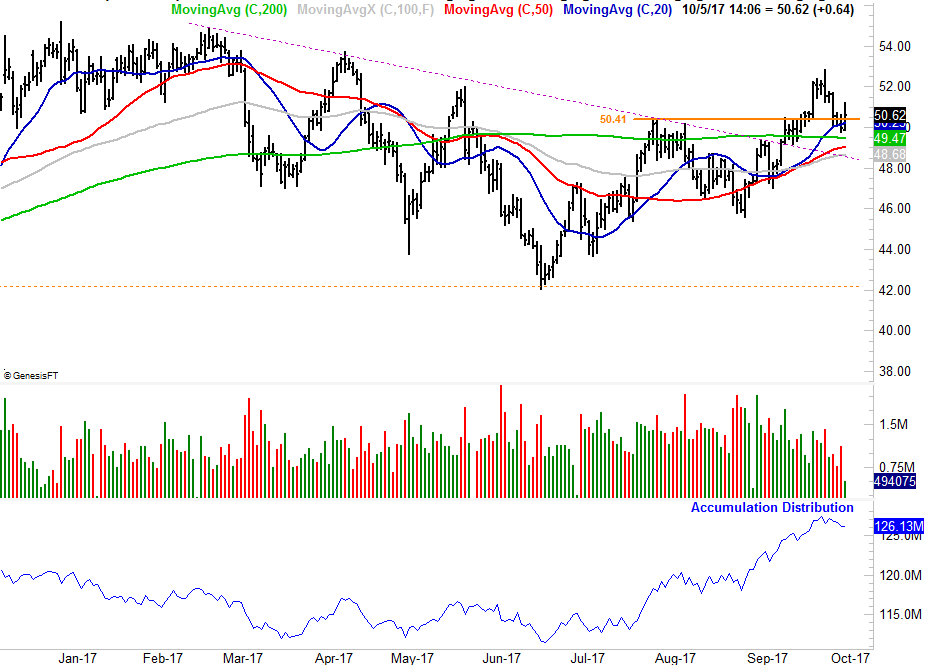
A couple of noteworthy nuances worth mentioning on the chart. First, note that while trading volume didn't swell once crude oil worked its way past $50.40, the pullback we saw with last week's volume was even less impressive. Point being, while we still can't say bullishness isn't a majority opinion for those that follow the oil market, we can't say bearishness is a majority opinion either.
Whatever the case, we'd still like to see more bullish volume materialize the next time crude makes a run; that run may already be underway.
The other nuance worth mentioning is that crude prices are now above all the key moving average lines, indication bullishness in all timeframes (even if that's a choppy bullishness).
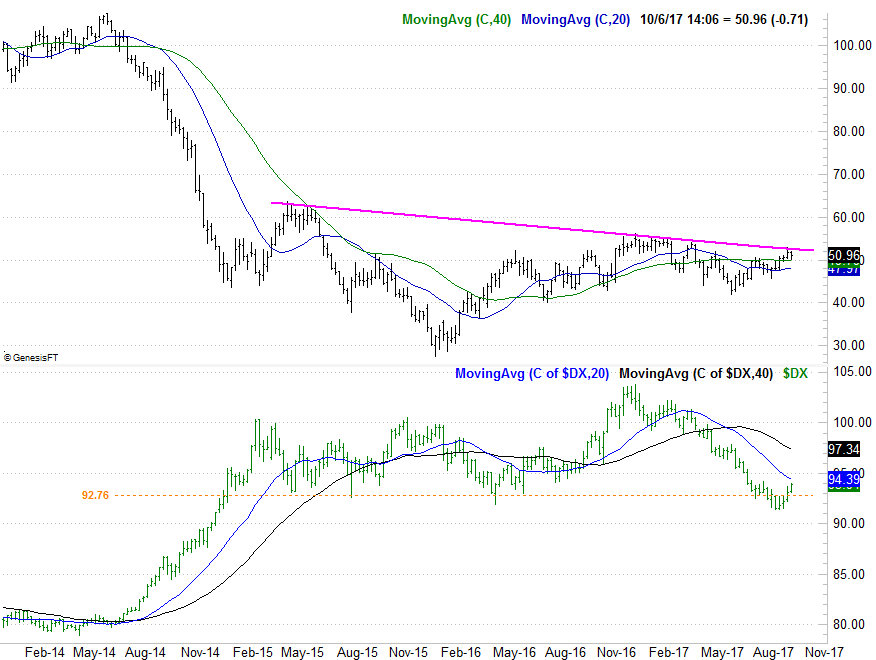
There's one more hurdle to clear, however. We just have to zoom out to the weekly chart to see it. In this timeframe we can see the technical ceiling (pink) that's tagged all the major peaks going back to mid-2015 is about to be broken as well. And, just as interesting is that this is happening without the help of a falling U.S. dollar, which has been on the rise again since mid-September.
If crude oil prices can get above that mark, there's not a lot to slow it down then.
As for where crude might end up if it's allowed to fully break free, there's some debate.
Know that the consensus opinion says crude prices should be no higher than $55 per barrel by the end of 2018, boding poorly for crude oil, and energy stocks. At the outside some estimates say $60 would be a long-term stretch. Also bear in mind, however, that these pros can and do change their mind, and have a tendency to either overshoot or undershoot, target-wise.
That's the polite way of saying they don't really know; they largely missed the implosion looming in 2014, even beyond the extent the rally in the U.S. dollar did the bulk of the damage. There was a major supply/demand imbalance these analysts just simply didn't catch.
With that as the backdrop, know that the supply is waning again. Even after oil stockpiles built following the brakes hurricane Harvey put on the industry a month ago, stockpiles are already falling again. Moreover, the United States continues to ramp up exports of crude... and OPEC doesn't appear in a mood to ramp up its output yet.
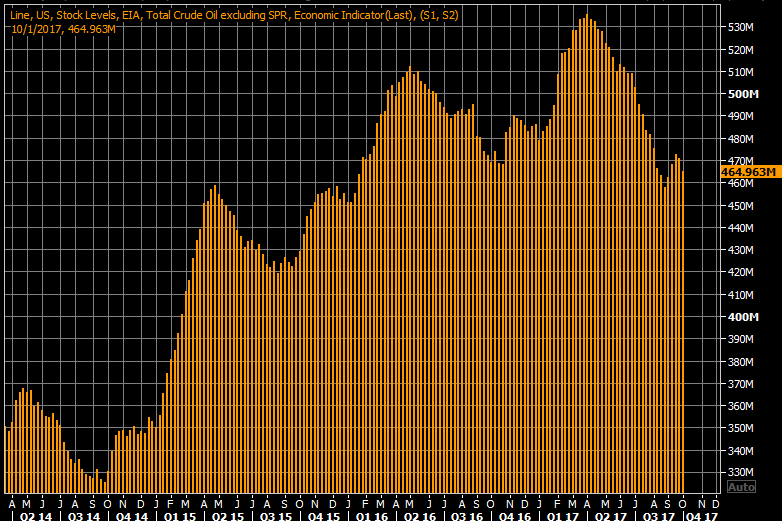
In other words, globally, more oil is still being consumed than extracted. In that these trends are difficult and slow to stop once started, we can't rule out the possibility that crude prices of $60 in the near future isn't a ridiculous idea to entertain.