Though it seems like it only started a few days ago, Q2's earnings season is closer to its end than its beginning. As of the end of last week, two-thirds of the S&P 500's companies have submitted their second quarter results.
So far so good. The large cap index is on pace to earn $30.62 for Q2, down just a bit from expectations of $30.97... before earnings season started. But, stocks rarely collectively meet their expectations; a handful of bad apples end up torpedoing the overall results. That $30.97 is up 19% year-over-year, largely thanks to a turnaround for the energy sector and strong growth from the technology sector.
That's just the large caps though. Indeed, the bulk of earnings season's media coverage only looks at large caps stocks, and the S&P 500's components. What about everything else? Namely, what about small caps, and/or the S&P 600 Small Cap Index?
The data is tougher to find, to be sure, but worth it for those who go to the trouble (like we did). See, the complexion of the large cap market's earnings trend isn't always the same as that of small caps, and analyzing them separately can often reveal unique opportunities that might not otherwise present themselves.
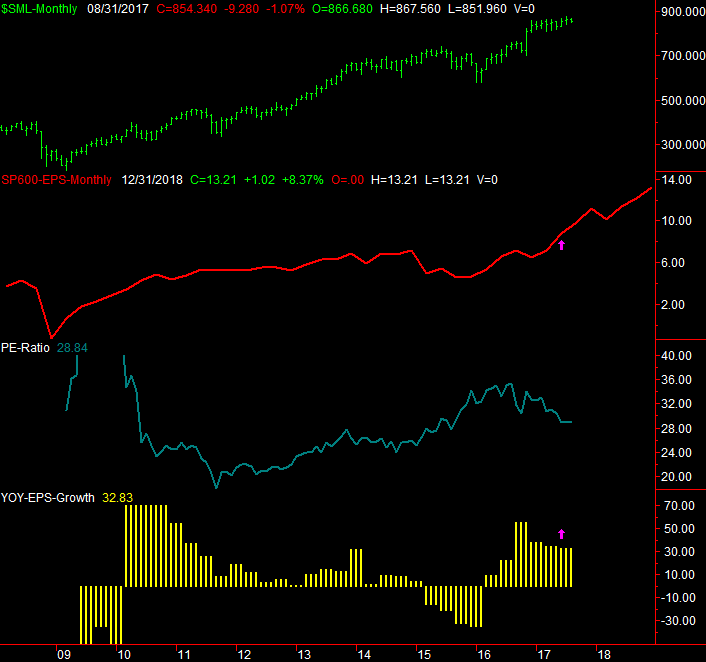
As of the end of July with roughly two-thirds of its constituents having posted their prior quarter's numbers, the S&P 600 Small Cap Index is on track to report Q2 income of $8.82. That's 33% better than year-ago levels, and like its large-cap counterpart, a turnaround from small cap energy stocks facilitated the bulk of the improvement. Healthcare and technology lent a big helping hand as well.
As is so often the case though, it takes a visualization to fully appreciate the bigger trend here, and how Q2's earnings for the S&P 600 fit into the bigger picture.
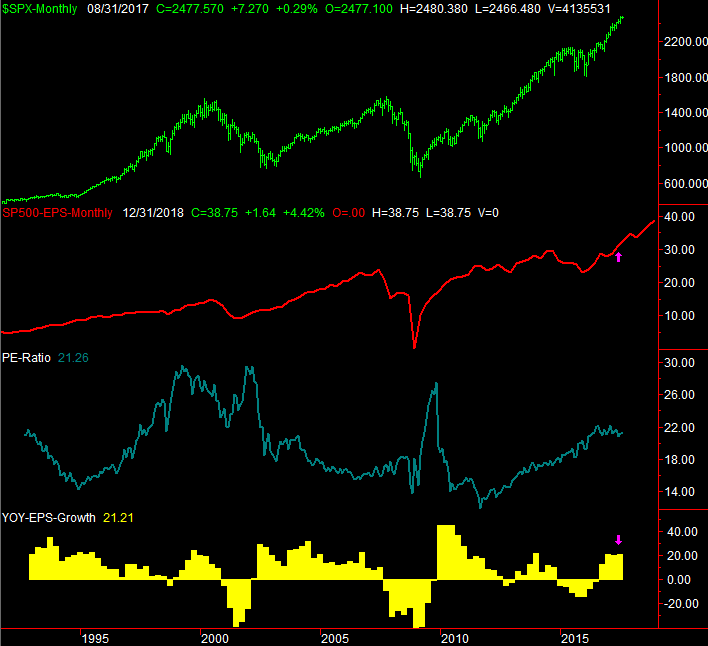
The graphic below is two-fold. On top is a plot of the S&P 500 and its trailing and projected per-share earnings, and at the bottom is the S&P 600 with its trailing and projected per-share profits. The pink arrows (and yellow dashed lines) mark Q2's earnings results.
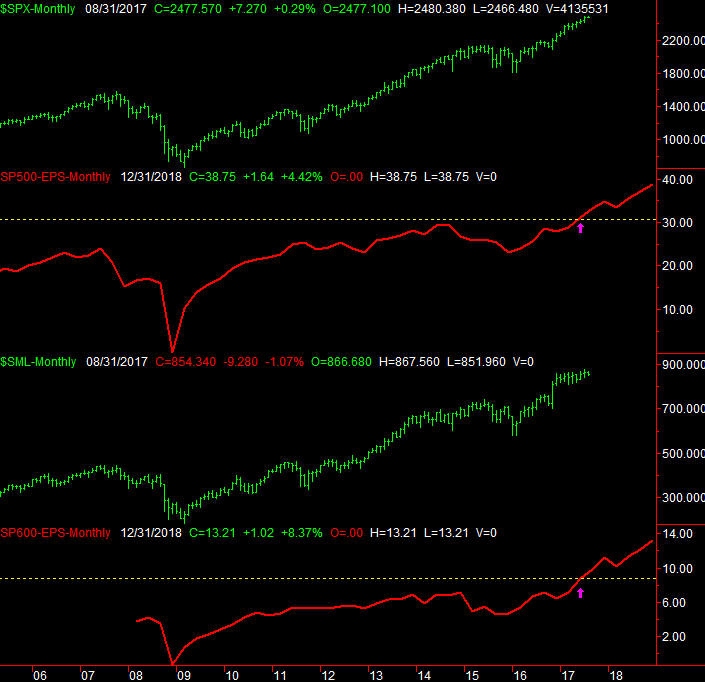
It's interesting. Small cap stocks have mostly underperformed large caps since the beginning of the year, yet small cap earnings growth has been much more robust.
The litmus test: The S&P 500's trailing P/E now stands at 21.2, while the S&P 600's trailing P/E is 28.8. The latter is clearly frothier than the former, but that's not unusual. More important is how those P/E levels compare to historical norms, and the S&P 600's valuation is closer to its long-term historical norm than the S&P 500's is.
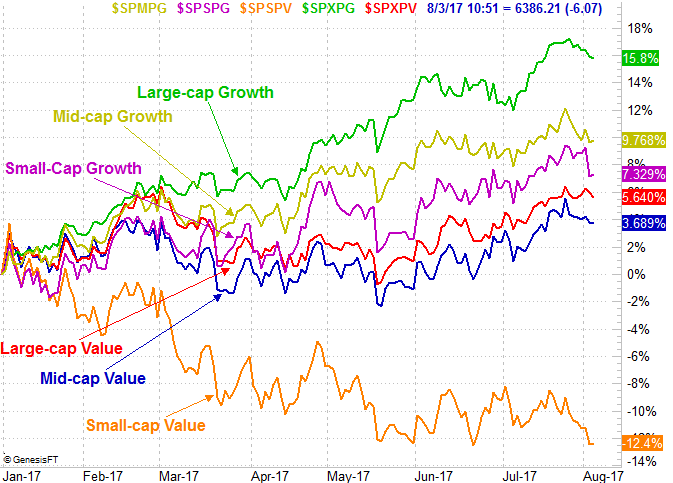
In other words, small caps offer more value right now than large caps do, largely because they've underperformed, while large caps have outperformed. Indeed, large cap growth stocks have been the decisive winner so far this year, while small cap value stocks are clearly an ugly laggard.
As they say though, nothing lasts forever.
Drilling deeper into Q2's earnings trend for small cap stocks, we can see just how well the aforementioned energy, healthcare and technology did last quarter. Utilities saw a nice bump too, though utilities and telecom are such a small part of the index's total earnings, neither of those changes matter much. [On the table below, everything from Q3-2017 forward is an estimate.]
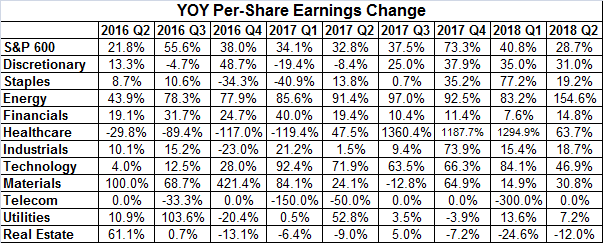
More important than each sector's Q2 earnings growth is each sector's earnings growth trend.
For the discretionary stocks, last quarter's slight earnings lull is part of a bigger pattern of inconsistent and lackluster earnings. Analysts expect things to improve -- considerably -- going forward, but those are tough outlooks to trust given there's no recent history of such growth. Financial stocks, on the other hand, are likely underestimated going forward based on the growth rates of the recent past. Technology, of course, is a rolling freight train, and healthcare stocks appear to have just started a big turnaround.
Not every small cap stock in a particular sector fits the bigger group's mold, obviously, so don't extrapolate too much from the data. On the flipside, averages are the averages for a reason. On that note...
... not only has the S&P 600 lagged the S&P 500 this year, it's lagged its typical year-to-date performance. Normally the small cap index would be up 4.6% for the year by early August, but it's only up 1.4% year-to-date right now, and still losing ground.

It remains to be seen if that's a setup for a "catch up" or if the index is following the path it takes in years it ends up dishing out a loss. Given the S&P 600's valuation and earnings growth though, it's easier to lean in a bullish direction.
Whatever the case, it's time to start taking a closer look at small cap stocks... probably. Just bear in mind the summer time -- August in particular -- is either very good or very bad for small caps. There's usually not much in between, even though the average suggests there is. We rarely see the average performance dished out. It's a tale of two extremes.
Down the road, small caps generally post a bullish fourth quarter no matter what.