Weekly Market Outlook – The Bounce Lacked Follow-Through (but There’s Little Room Above Anyway)

Stocks bounced back a bit last week, following through in the previous week’s late effort to recover from an early-June drubbing. The effort was largely spent after Monday’s strong open though. Past that, the rally was out of gas. Friday’s slight gain was the only reason the S&P 500 was able to end the week with a slight win, up 0.8%. More important than that, however, nothing about last week puts the stock market back in bullish mode. There’s still plenty of room and reason for the market to peel back from here.
We’ll look at how and why in a moment. First, let’s look at last week’s top economic reports, and preview what’s going to be reported this week.
Economic Data Analysis
Last week’s big news was of course the Federal Reserve’s expected decision to leave interest rates alone. But, that wasn’t the biggest part of Wednesday’s news. Under new chairman Kevin Warsh, the FOMC’s official statements/assessments are now shorter, sweeter, and this time around, optimistic about the domestic economy. Although riddled by inflation right now, the Fed expects the U.S. economy to remain reasonably robust into and through next year. In fact, odds are we’ll see at least a quarter-point hike in the Fed Funds Rate. The market’s not yet decided if that glass is half-full, or half-empty.
That wasn’t the only economic news dished out last week, however. The party actually started on Monday with last week’s capacity utilization and industrial productivity report, also from the Federal Reserve. Both inched a little higher -- again -- extending growth trends that have been grinding higher since last year.
Capacity Utilization, Industrial Productivity Charts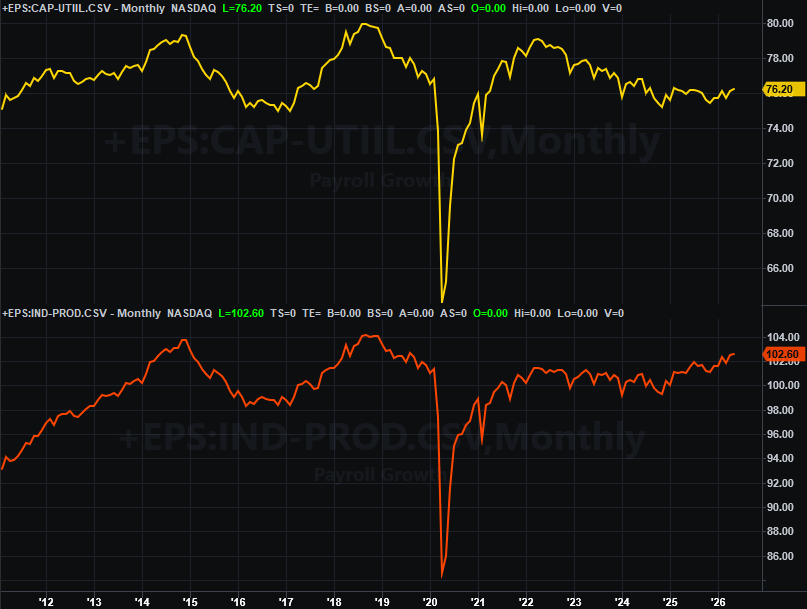
Source: Federal Reserve, TradeStation
It says confirms the domestic economy is doing better than it seems like it should be, given the headlines, worry, and pessimism.
On Tuesday we got an important updated look at the nation’s residential real estate picture, partially confirming this sliver of the economy’s current dysfunction. Specifically, while May’s building permits more or less matched April’s level, it’s still at a (very) low level. Housing starts, meanwhile, somehow plunged to a low pace of 1.17 million that’s not been worse since the COVID-pandemic-prompted plunge of early 2020.
Housing Starts, Building Permits Charts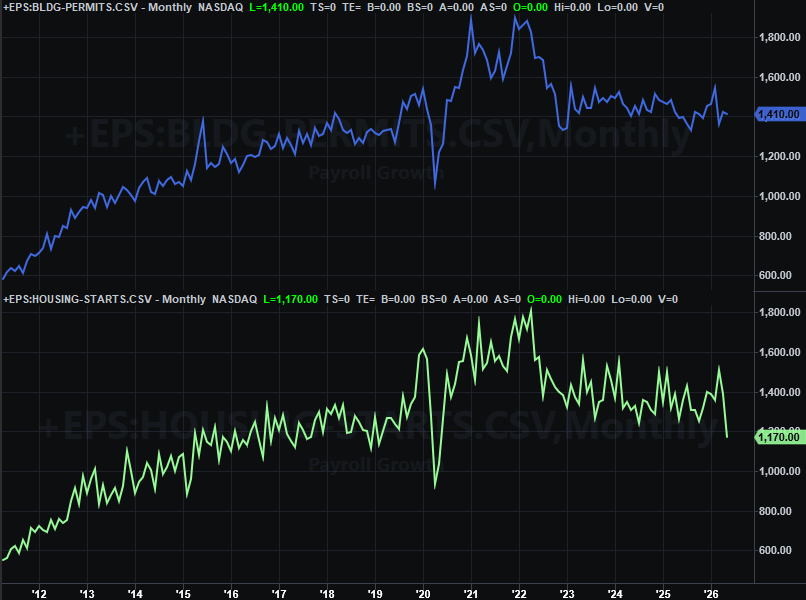
Source: Census Bureau, TradeStation
That starts number is so bad that it seems likely to be errant, and due for an upward revision a month from now. While still not good, things don’t somehow seem this bad.
Finally, on Wednesday he heard last month’s retail sales data from the Census Bureau. They grew again, as expected, at the same accelerated pace we’ve seen since February.
Retail Sales Charts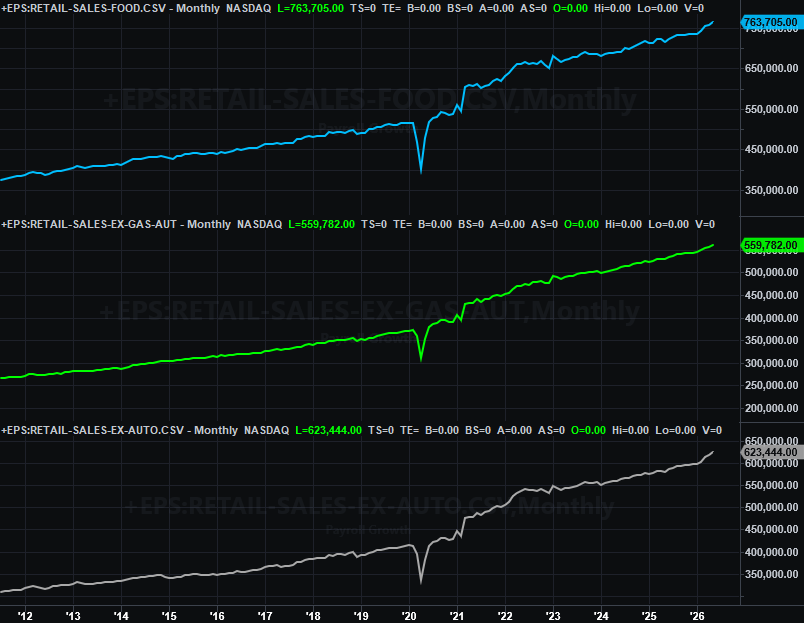
Source: Census Bureau, TradeStation
Higher prices account for some of this accelerated growth. Just note that consumers are clearly in a strong-enough position to pay these higher prices.
Everything else is on the grid.
Economic Data Report Calendar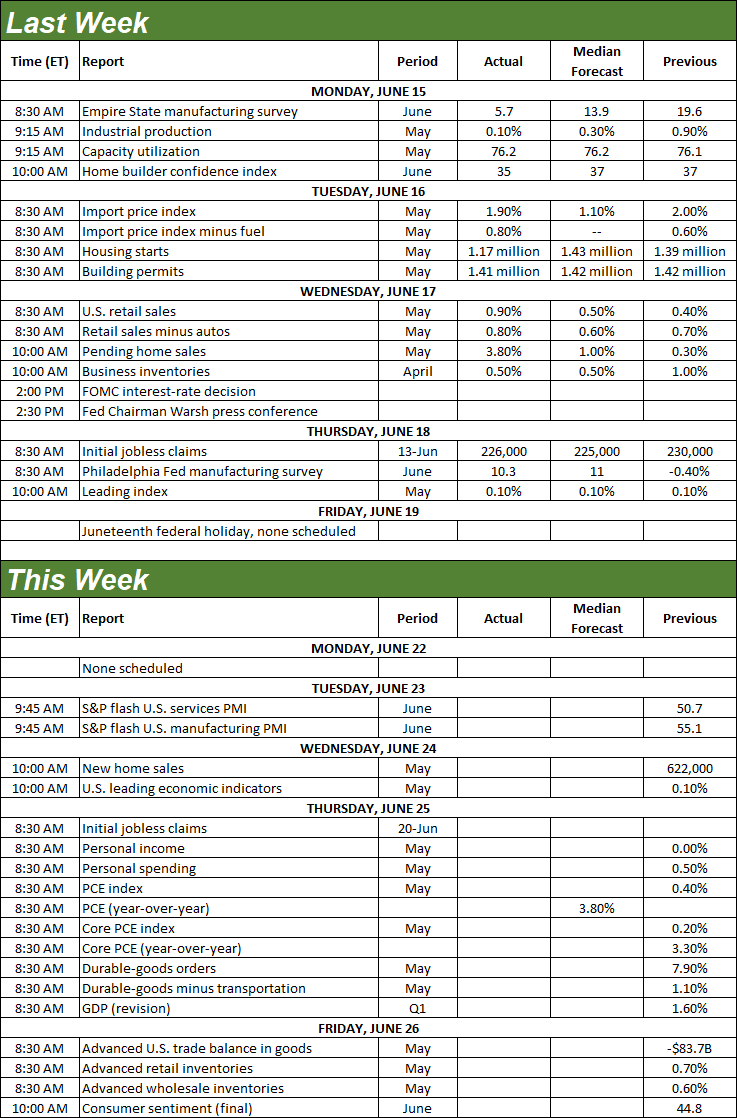
Source: Briefing.com, TradeStation
This week’s first big report is last month’s new home sales, due from the Census Bureau on Wednesday. You may recall May’s sales of existing homes were up a little more than anticipated, although are still rather low. Ditto for new-home sales, and aren’t likely to have mustered a major improvement last month either.
New, Existing Home Sales Charts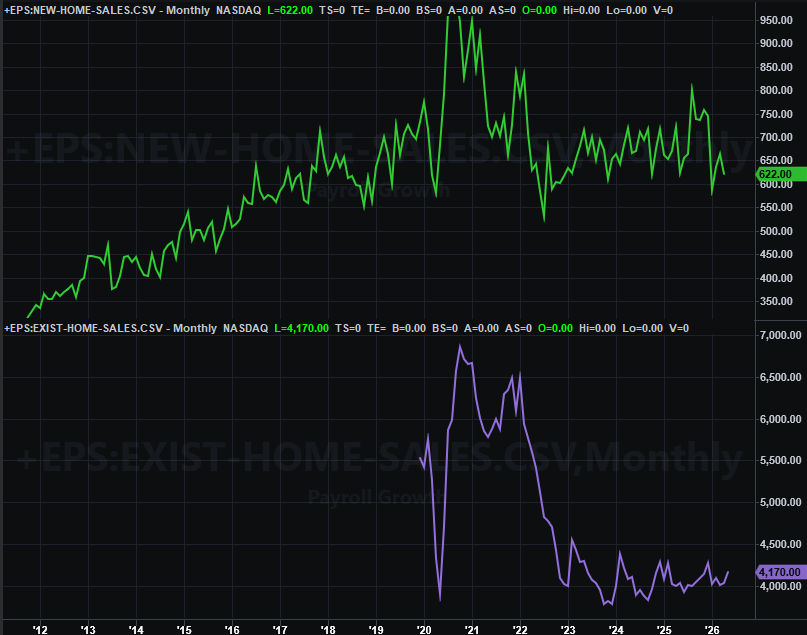
Source: National Association of Realtors, Census Bureau, TradeStation
There’s no chart of it here, but also know we’ll be getting another key report on Thursday. That’s last month’s personal income and personal spending, which the Federal Reserve considers when making interest rate decisions. Both have remained firm despite recent economic headwinds, affirming at least a decent degree of economic strength. At the very least it dials back the need for and likelihood of a rate cut.
Finally, on Friday look for the third and final reading of the University of Michigan’s look at consumer sentiment for June. We might see some improvement simply because the current reading is simply so low. But, consumers are almost certainly still voicing pessimism… despite their incomes and a willingness to spend them.
Consumer Sentiment Charts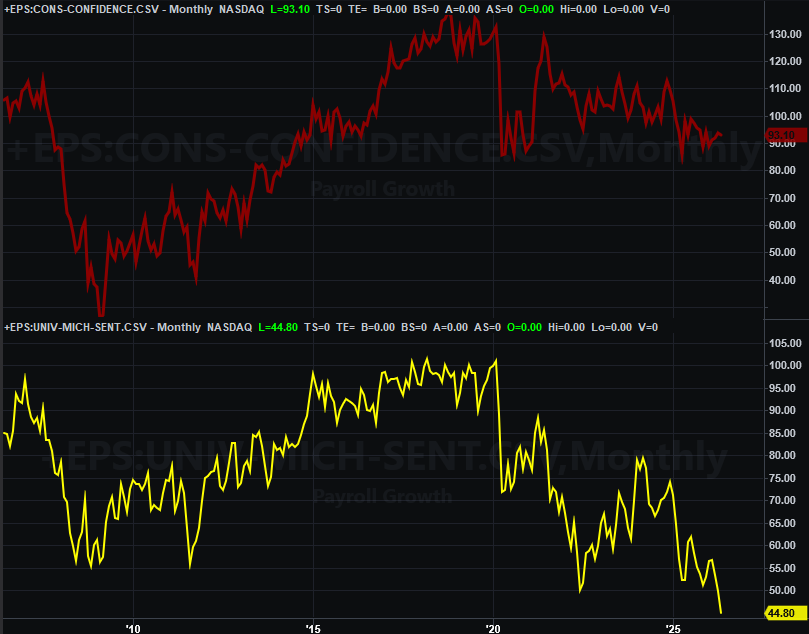
Source: Conference Board, University of Michigan, TradeStation
The Conference Board’s measure of consumer sentiment will be released next week. It too is at miserably low levels, and likely to remain at least near there this time around.
Stock Market Index Analysis
We start this week’s analysis with another zoomed-in view of the daily chart of the S&P 500, just to show you the detail of how things shaped up last week. Stocks shot higher on Monday, extending the gains seen late in the prior week. But, that was it. Those buyers quickly changed their mind, allowing the index to slide back under the 20-day moving average line (blue). It barely fought its way back above that pivotal line by Thursday’s close (the market was closed on Friday), although it could have essentially and effectively closed right at that level, suggesting indecision.
S&P 500 Daily Chart, with Volume and VIX 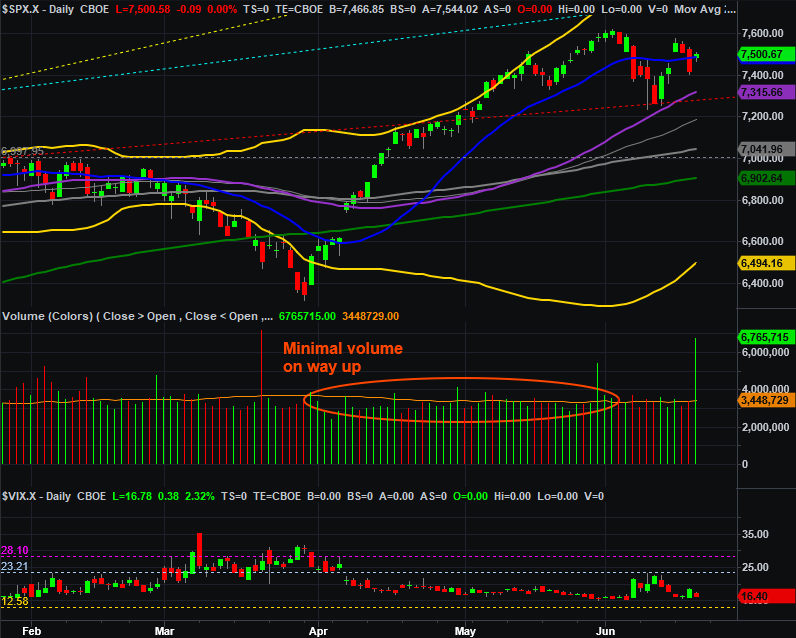
Source: TradeNavigator
Zooming out to a weekly chart of the S&P 500 illustrates why the rebound effort petered out. The index is still right at the upper boundary of the long-term resistance line that it bumped into four weeks ago. Even if it wasn’t precisely tested last week, the weight of being near this ceiling is still holding the bullish effort back simply because there’s not much room above.
S&P 500 Weekly Chart, with MACD and VIX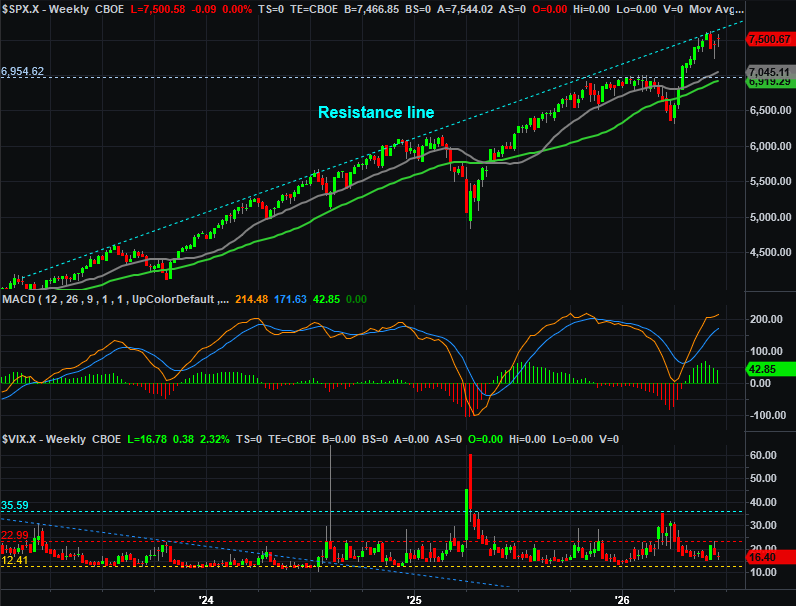
Source: TradeNavigator
The NASDAQ Composite looks about the same, although as we noted last week, the NASDAQ’s push up and off of the 50-day moving average line (purple) as just about perfect. Look for it to be a factor again, assuming it’s retested again… which we think it will be.
NASDAQ Composite Daily Chart, with Volume and VXN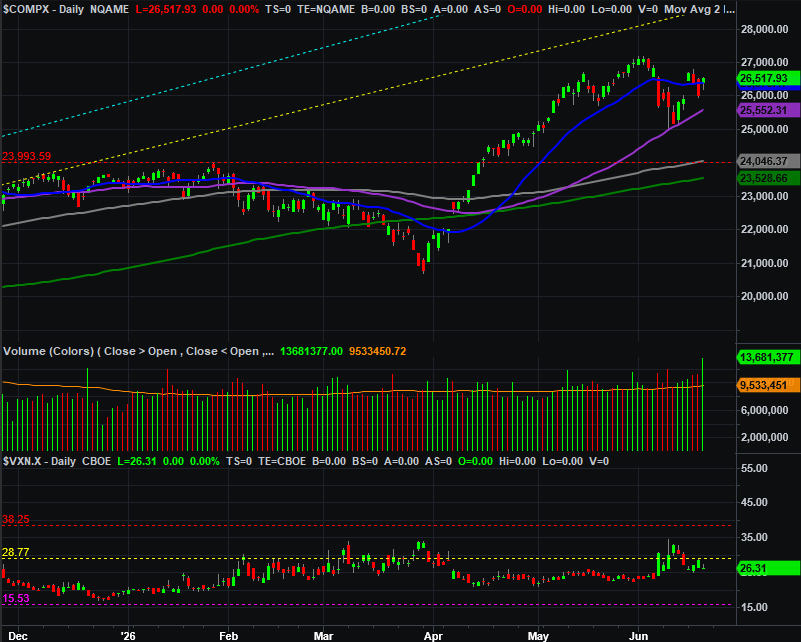
Source: TradeNavigator
So what’s the call? Despite last week’s apparent turnaround effort, we’re not convinced this is the beginning of a prolonged rebound. It looks more like a dead-cat bounce fueled by a kiss of the 50-day moving averages that will fade soon enough, ceding the way for another pullback effort that finally produces a long-overdue full correction.
That being said, the clues/signs for that remain rather clear. That’s a move below the 50-day moving averages paired with the VIX’s break above what’s turned into a technical ceiling around 23.4. If things move past those levels, the bears may have little choice but to follow-through and dish out that correction. We’ll discuss downside targets if-and-when that reason to develops.