Weekly Market Outlook – Not an Insurmountable Blow

We’ve mentioned for the past couple of weeks that stocks were playing with proverbial fire. Traders finally got burned last week, with the market tumbling to and then below a handful of technical support levels.
Even so, last week wasn’t horrifying. The S&P 500 only ended up losing 2.4% of its value, which isn’t chump change, but isn’t exactly insurmountable either. The bleeding was stopped and even partially reversed. There’s still a chance the bigger-picture rally could be rekindled (not that a little more corrective action wouldn’t be a healthier outcome to suffer through at this point).
We’ll show you just how on-the-fence things are at this time in a moment. Let’s look at last week’s top economic announcements first.
Economic Data Analysis
Superficial consumerism seems to be perking up. And, there are some bright spots among the economic barometers updated last week. There are some red flags, however, in some of the numbers released last week. Of course, the big news from last week was the decision from the Federal Reserve regarding interest rates. We got the quarter-point cut we were expected, but the FOMC also said it wasn’t going to cut rates as aggressively as first thought over the course of the next couple of years.
Connect the dots… things could still go either way from here, in an environment where it almost seems like there are two different economies at work.
In any case, the party started in earnest on Tuesday, with a look at last month’s retail spending as well as last month’s industrial production and capacity utilization. As the chart below shows, retail sales through November continue to improve at a slow and steady pace.
Retail Sales Charts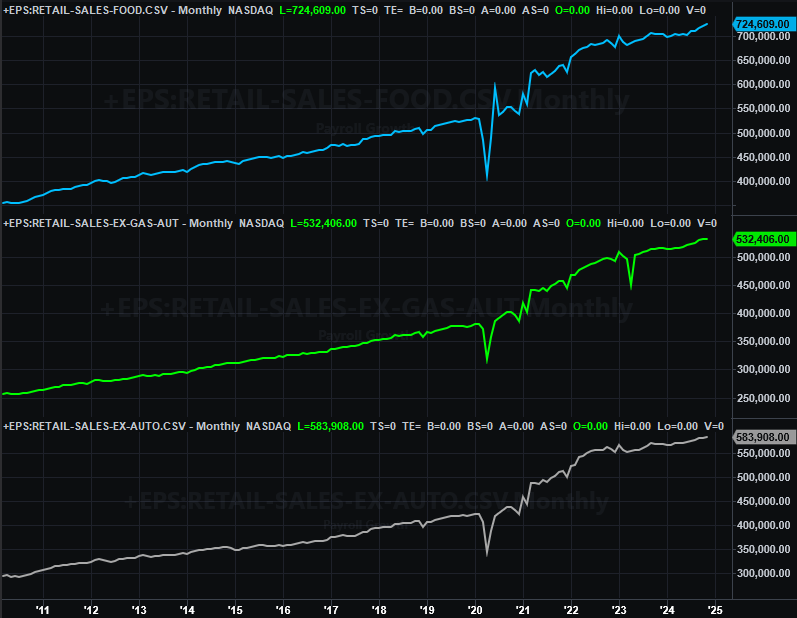
Source: Census Bureau, TradeStation
Factories continue to slow down as well. Actually, industrial activity edged a little higher, but the pace of progress slowed to practically nil, while capacity utilization once again declined in November.
Industrial Production and Capacity Utilization Charts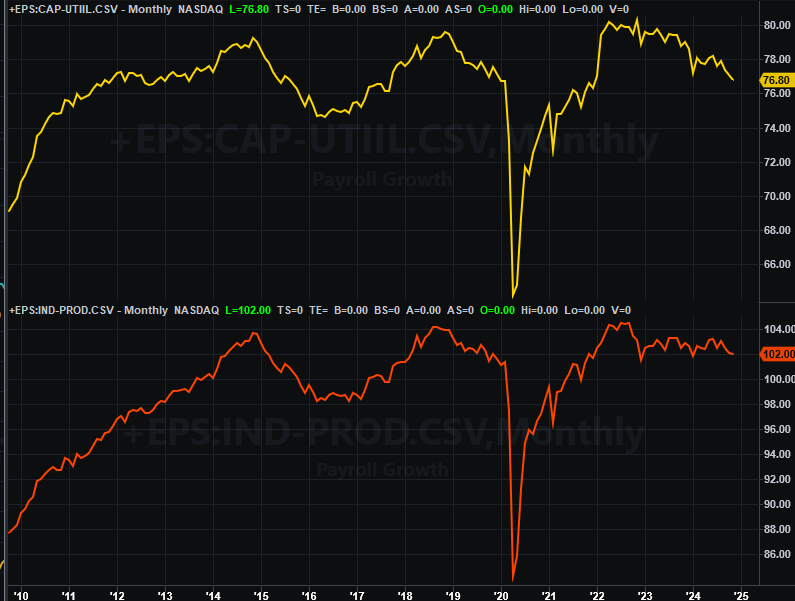
Source: Federal Reserve, TradeStation
This is a problem that’s too significant to simply ignore. Corporate earnings and eventually the stock market itself move in step with the Fed’s industrial output measure and the usage of the nation’s industrial capacity. Something’s going to change sooner or later, and probably sooner than later.
Although we’re not charting it here, also notice on the grid below that last month’s personal incomes and personal expenditures are also still relatively firm. Although not yet “inflationary,” the Fed is almost certainly concerned that things could quickly move in that direction.
Economic Calendar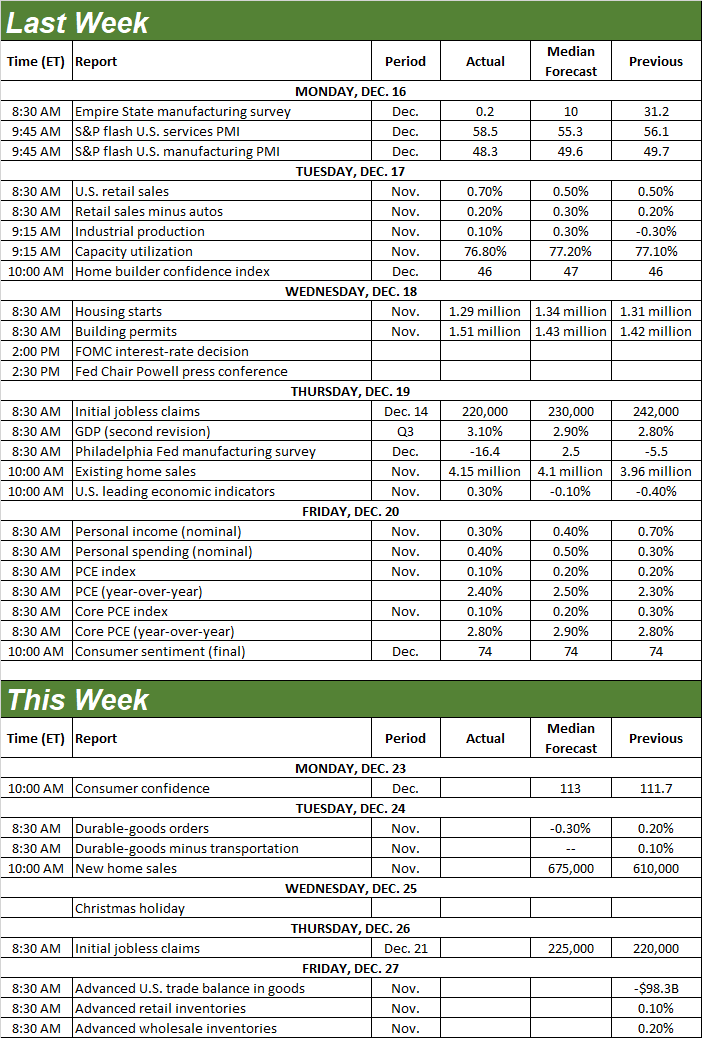
Source: Briefing.com
Although this week should be relatively quiet due to the midweek Christmas break, we’re still going to hear a couple of important updates.
The first of these reports is December’s consumer confidence figure from the Conference Board, due on Monday. We saw the University of Michigan’s sentiment index score tick a little higher for December last week, and the Conference Board’s number is expected to follow suit.
Consumer Sentiment Charts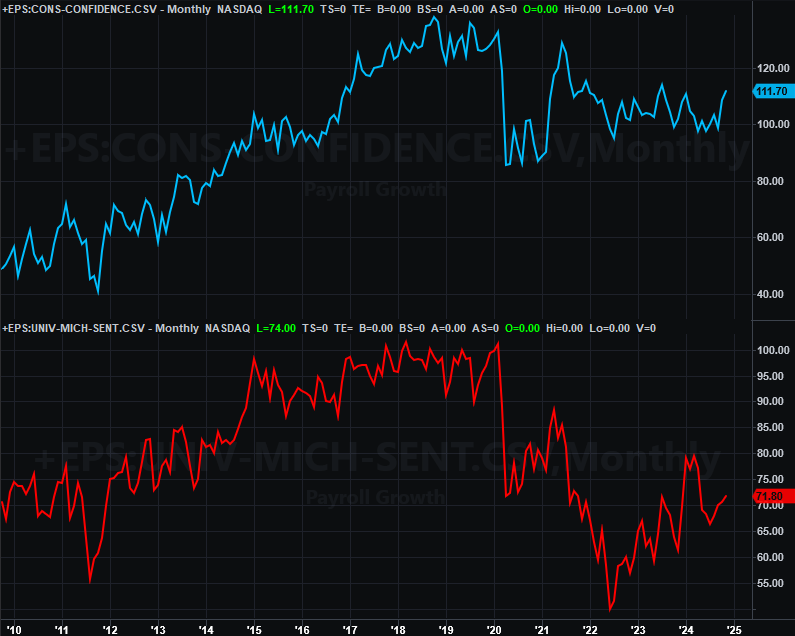
Source: University of Michigan, Conference Board, TradeStation
The other update in the lineup is last month’s new-home sales figures due on Tuesday, rounding out last week’s update on sales of existing homes. Existing home sales ticked a little higher, and by slightly more than expected. Forecasters are calling for even more improvement in new home sales. Both of course are being boosted by the recent lull in interest rates… a lull that’s been mostly wiped away since then.
New, Existing Home Sales Chart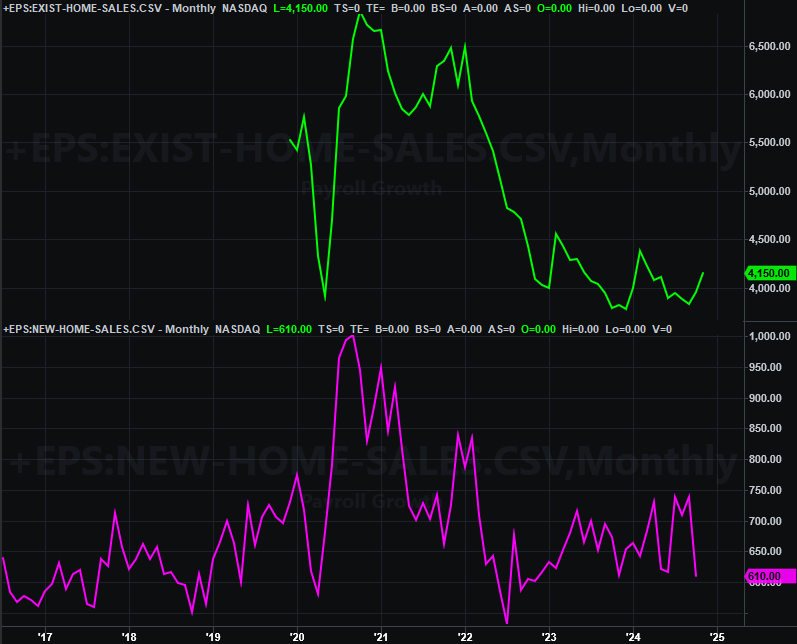
Source: Census Bureau, National Assn. of Realtors, TradeStation
Whatever the case, total demand for homes remains nearer multi-year lows than not.
Stock Market Index Analysis
There’s no need to dance around the issue… the market got shellacked last week. As the daily chart of the S&P 500 below shows us, most of the damage was down on Wednesday, when the index broke under its 50-day moving average line (purple) at 5,933. (Notice that even with Friday’s intraday rebound effort, the S&P 500 didn’t actually climb back above the 50-day line.) The daily chart also shows us, however, that the setback ultimately started three weeks ago when the index first bumped into a technical ceiling (light blue, dashed) connecting all the key highs going back to mid-2023.
S&P 500 Daily Chart, with VIX and Volume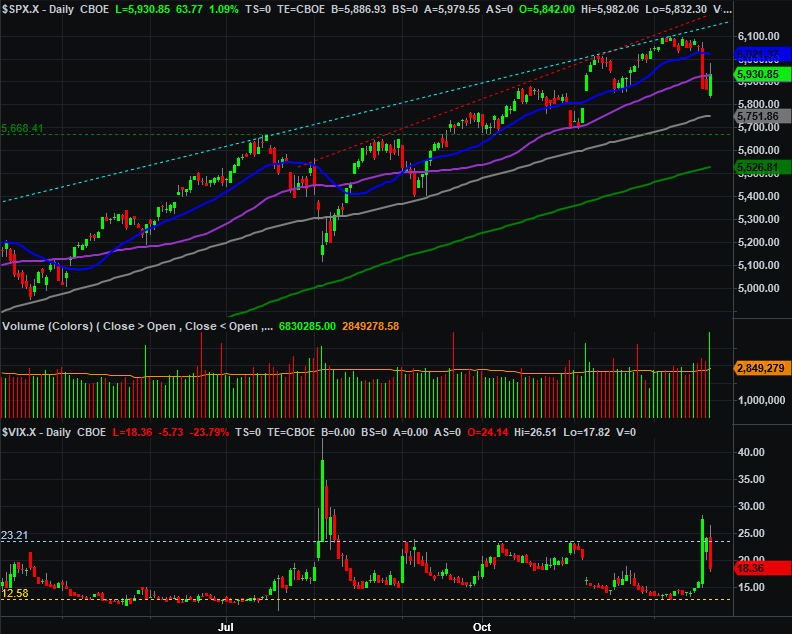
Source: TradeNavigator
Here’s the weekly chart of the S&P 500, which doesn’t show us anything new, but it does put things in more perspective. Namely, even with last week’s 2.4% tumble, the index is still within the upper half of a rising trading range that’s been in place since 2023. Translation: There’s still room for the S&P 500 to keep moving lower before longer-term support levels are tested. The 200-day moving average line (green) at 5,547 is one of those floors, along with straight-line support (yellow, dashed) connecting last December’s and this August’s lows.
S&P 500 Weekly Chart, with VIX and MACD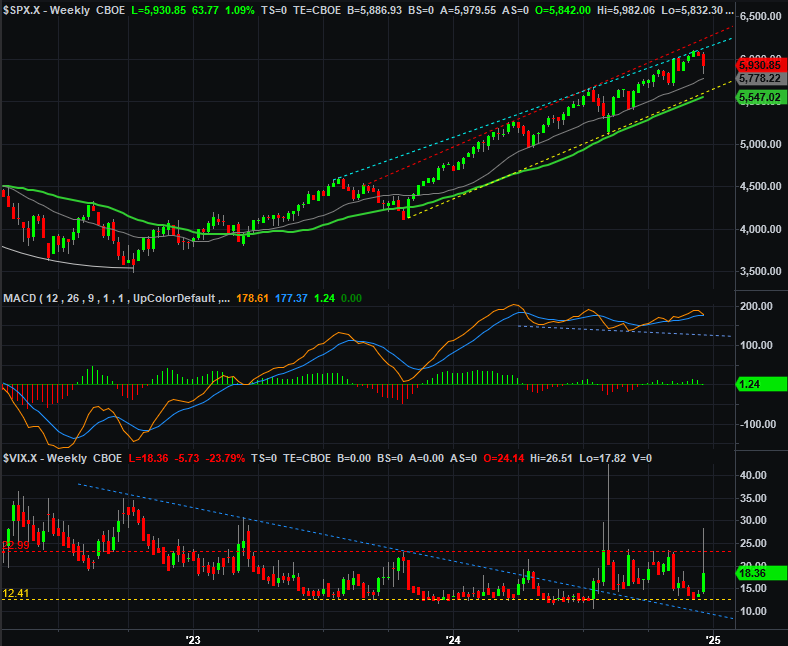
Source: TradeNavigator
Same basic story for the NASDAQ Composite. It tumbled to the tune of 1.8% last week, although at one point on Friday was down as much as 3.8%. Like the S&P 500 though, the setback ultimately started when the composite bumped into near-term technical resistance (purple, dashed) currently at 20,200. Notice that even with Friday’s turnaround, the NASDAQ still just barely crawled back to its 20-day moving average line (blue) around 19,600.
NASDAQ Composite Daily Chart, with VXN and Volume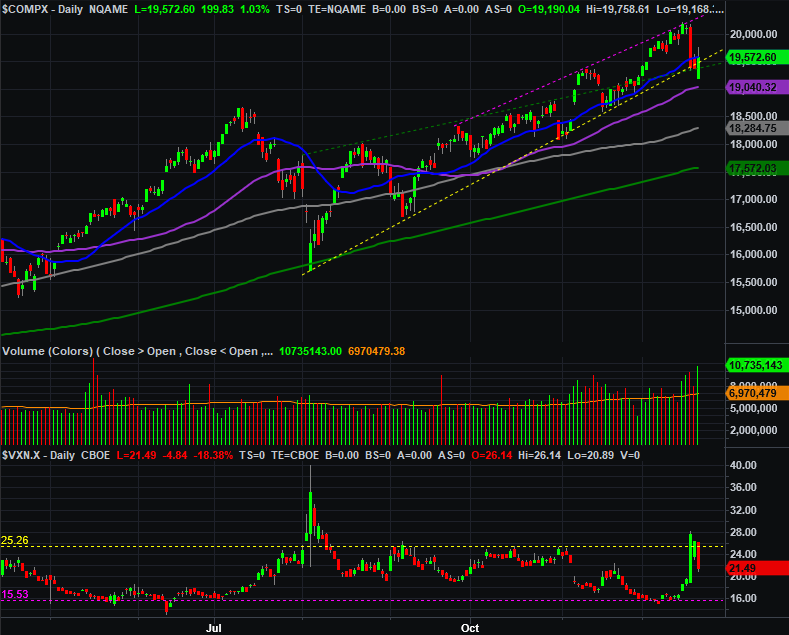
Source: TradeNavigator
As was the case with the S&P 500, the weekly chart of the NASDAQ Composite is being steered by rising support and resistance lines… a few of them, in fact. (See all the dashed lines below.) As you can see, although the NASDAQ seems to be finding support right now, there’s lots of room for the composite to go through at least a somewhat serious correction without actually ending the bull market. And again, that might actually be the healthier near-term outcome.
NASDAQ Composite Weekly Chart, with VIX and MACD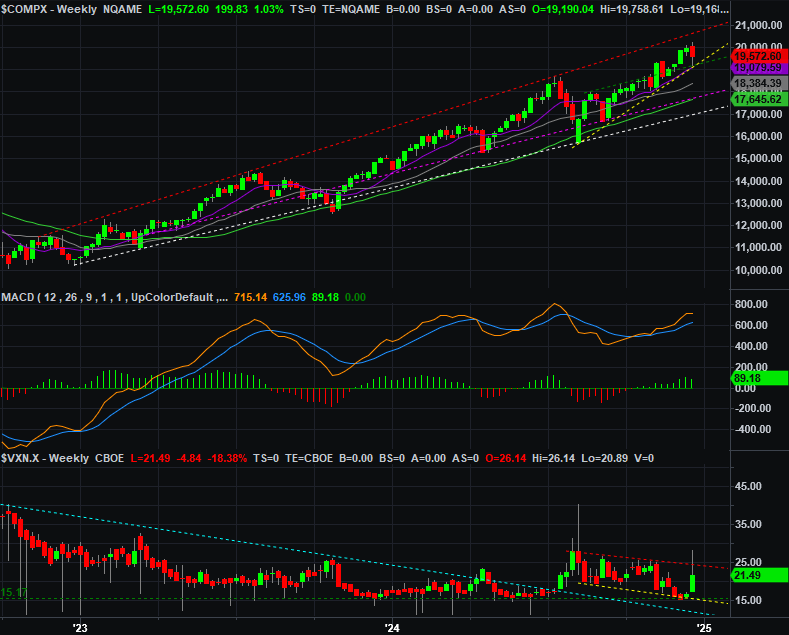
Source: TradeNavigator
Notice that in both cases neither volatility index made a net change in direction or level. They simply -- and temporarily -- soared in the middle of the week in response to Wednesday's wild action before sliding back to their recent levels. Any major changes in the market's direction should also be evident with the VIX and VXN. As it stands right now, there's no evidence of major change with either.
So what’s the call? Last week was so volatile that we probably shouldn’t be making any major calls here; both indices ended last week on the fence anyway.
Even so, the proverbial path of least resistance is still to the downside, all the way back to long-established technical floors. Just understand that the bulls unwound a great deal of last week’s technical damage before it had a chance to truly set in. Given that this coming week is generally a modestly bullish one anyway, there’s a (very) good chance stocks might be able to ease back into their bigger-picture uptrend and retest the upper boundaries of technical ceilings that have been in place for months now.