
Weekly Market Outlook – Jerome Powell Turns Back the Bearish Tide

Picking up where things left off from the week before, last week started out on a bearish foot, and remained on a bearish foot through Thursday. Most of the key indexes broker under some relatively important technical support, in fact.
Then Friday, everything changed. All that Fed Chairman Jerome Powell had to do was mention the possibility of an interest rate cut next month. Traders pounced, unwinding most -- if not all -- of the week’s losses.
It’s tempting to jump back on the bullish bandwagon. And, perhaps that will end up being the right call. Friday’s bullish jolt isn’t quite ideal though. It may not foster much follow-through. We’ll see.
But first, let’s run through last week’s economic news and preview what’s coming this week. Spoiler alert: There’s a great deal of real estate data to digest.
Economic Data Analysis
The party kicked off in earnest on Tuesday, with last month’s housing starts and building permits. They were up, and down. Starts of 1.43 million came in well above the expected lull to 1.29 million, but permits fell even more from June’s pace of 1.44 million, to 1.35 million.
Housing Starts, Building Permits Charts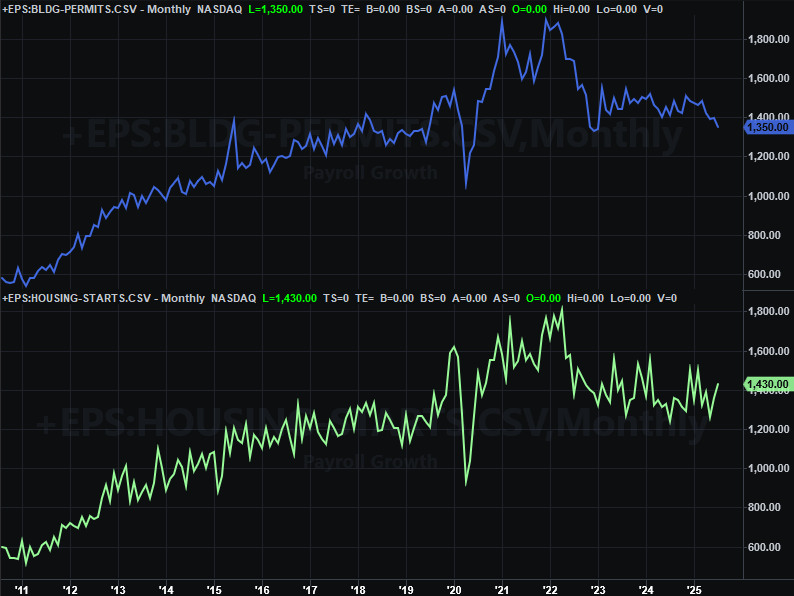
Source: Census Bureau, TradeStation
This is more bearish than not. Permits set the tone for actual starts for at least a couple months out, and permits continued their slide to another multiyear low. While the uptick in starts was relatively solid, it still wasn’t enough to shake the trend out of its long-term rut.
Then on Thursday we got July’s sales of existing homes. They ticked up from 3.93 million to 4.01 million, slightly topping expectations of 3.91 million. As the chart shows though, this is no meaningful progress whatsoever.
Home Sales Charts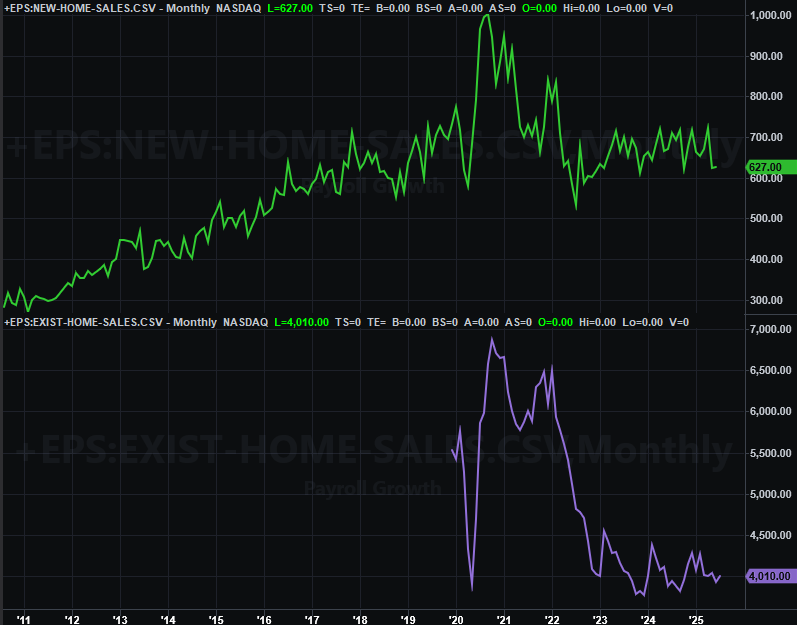
Source: National Assn. of Realtors, Census Bureau, TradeStation
Last month’s new home sales will be posted on Monday of this week. Economists are looking for a slight improvement on June’s figure of 627,000. That number, however, is still clearly pretty low.
Everything else is on the grid.
Economic Data Report Calendar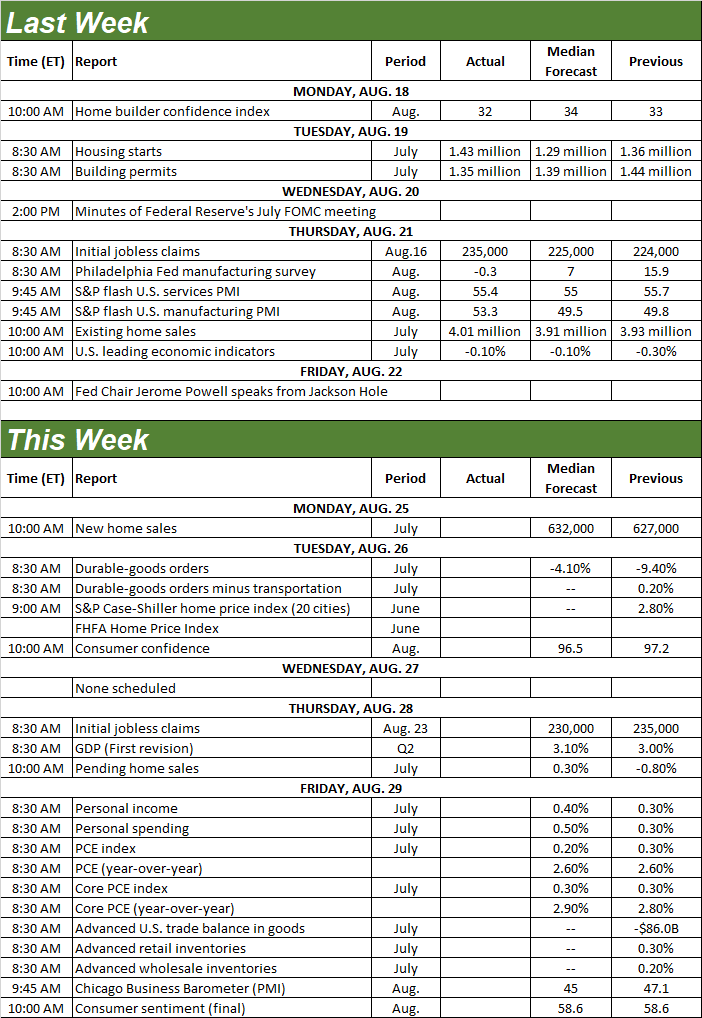
Source: Briefing.com, TradeStation
The real estate report card will be rounded out on Tuesday of this week with June’s home price data. The Case-Shiller Index (20-city) will likely continue rising, although odds are good we’ll continue to see the shallow slide in the FHFA Home Price Index.
Home Price Index Charts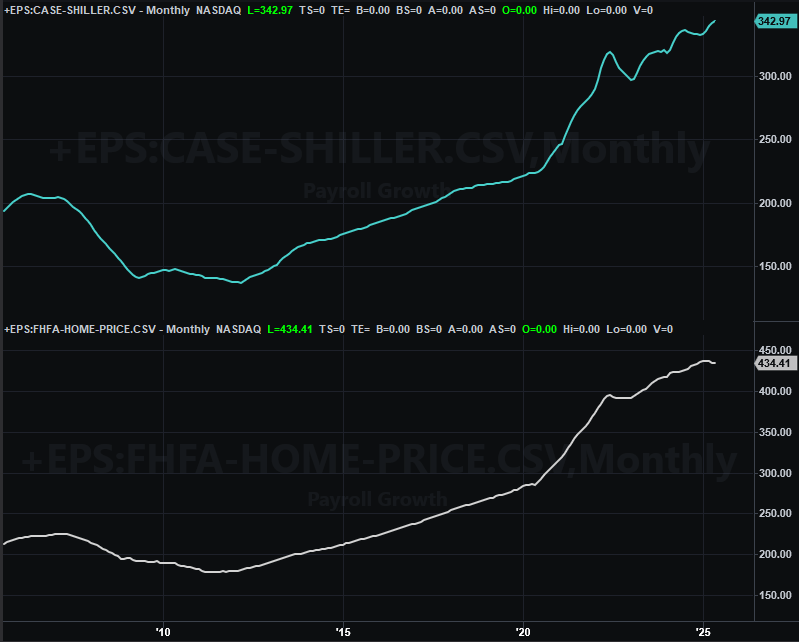
Source: Standard & Poor’s, FHFA, TradeStation
As we’ve noted before, this disparity likely reflects sales of the kinds and prices of homes that would qualify for such a loan; the lower-end market is starting to struggle, whereas the higher-end market is holding up. Just bear in mind both data sets only reflect the price of homes that actually transacted. Homes that don’t sell at any price aren’t included in either number.
Also on Tuesday look for August’s consumer confidence report from the Conference Board, with the month’s third and final look at consumer sentiment slated for Friday. Both are likely to fall just a bit from July’s figures, with the long-hoped-for recovery being somewhat undermined.
Consumer Sentiment Charts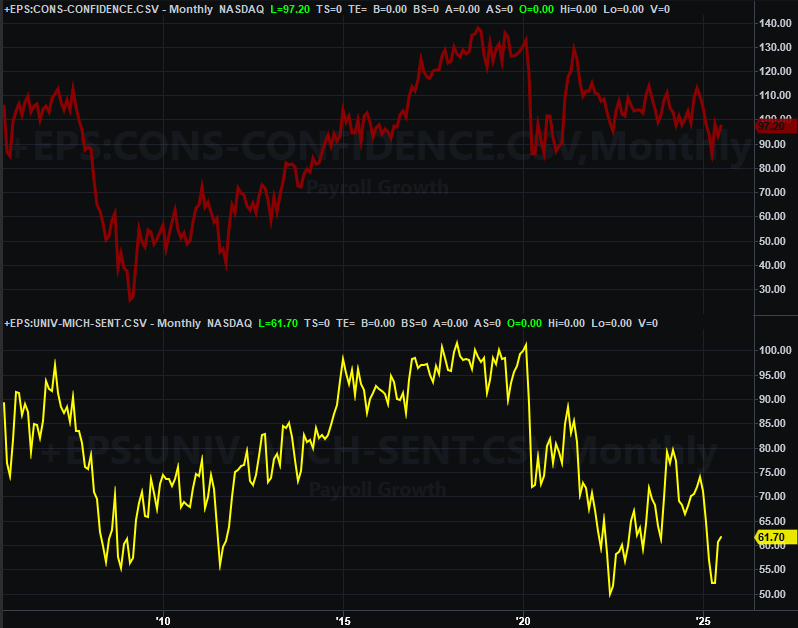
Source: University of Michigan, The Conference Board, TradeStation
Although we’re not charting it, also be aware that on Friday we’ll get July’s consumer spending and personal income report from the Bureau of Economic Analysis, which is one of the key numbers the Fed considers when making decisions about interest rates. This data may offer some additional insight as to what Jerome Powell and the FOMC end up deciding for next month.
Stock Market Index Analysis
As of Thursday’s close, the S&P 500 was down 1.2% for the week. By Friday’s close, it was back in the black by just a hair. Thank you Fed Chairman Jerome Powell. Mere chatter about a rate cut next month was enough to change most peoples’ minds, and push the index back above the 20-day moving average line (blue, at 6,397 on the daily chart below) it fell under earlier in the week. In fact, Friday’s close of 6,466.91 was the index’s highest-ever weekly close. That’s clearly a bullish way to end the week.
S&P 500 Daily Chart, with Volume and VIX 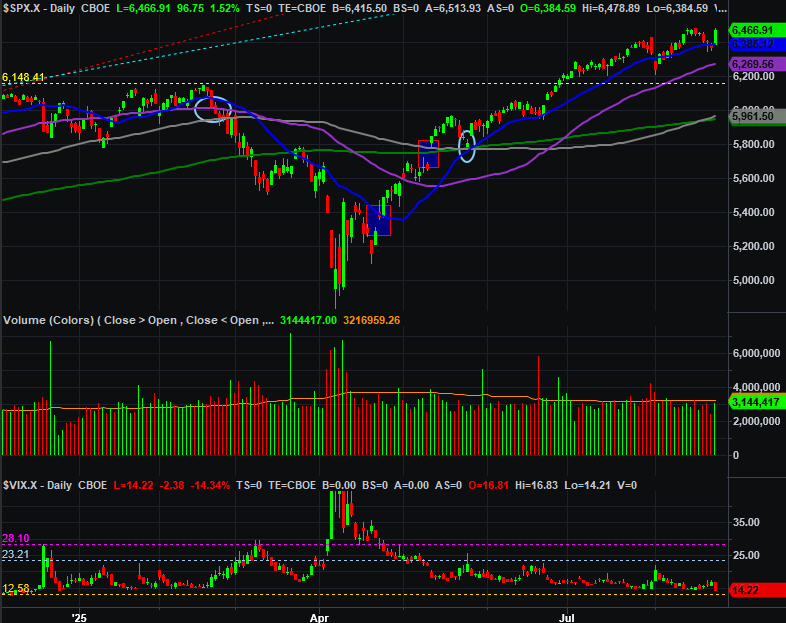
Source: TradeNavigator
The daily chart of the NASDAQ Composite looks similar, but not identical. It too fought its way back above its 20-day moving average line (blue) at 21,286, and did so on decent volume. It didn’t close at a record though, and it’s not like the volume was enormous. That could be good though. It suggests the bulls might be pacing themselves, allowing them to maintain the move without inviting profit-taking. The only problem with that stance is just that there’s already so much profit-taking potential on the table following the huge runup from April’s low.
NASDAQ Composite Daily Chart, with Volume and VXN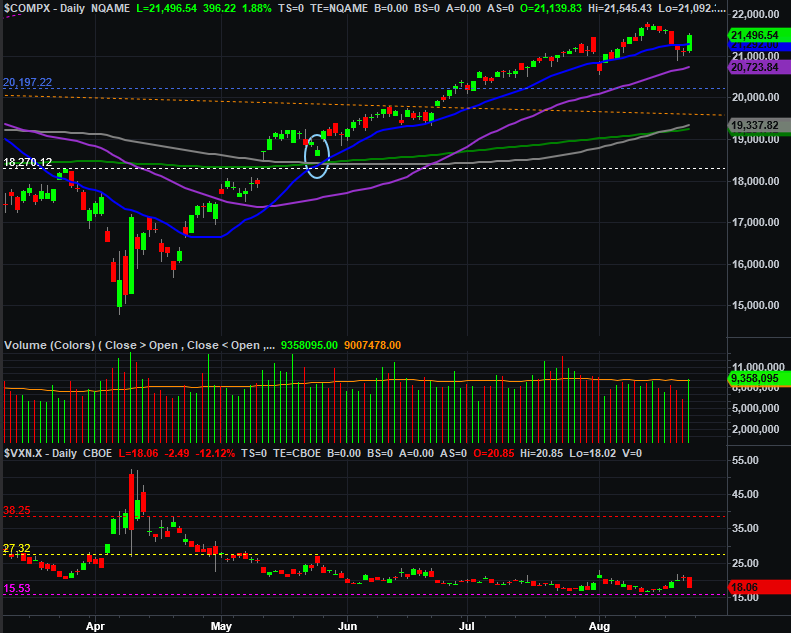
Source: TradeNavigator
There’s something else subtle, curious about the NASDAQ’s daily chart. If you look closely you’ll see that on Wednesday as well as Thursday the bulls were already pushing it back off of its intraday lows (and especially Wednesday). Was the market simply waiting for -- perhaps anticipating -- a reason to plow back into stocks, and found Powell’s comments from Jackson Hole were enough? Never say never. If this is the case, the reversal effort may be a bit better grounded than it seems with just a glance. Underscoring this argument is the fact that the volume behind the selling in the middle of the week was never huge, and faded as it progressed.
And for what it’s worth, the Dow Jones Industrial Average easily popped past its technical resistance around 45,632 today to race to a strong record close. This could mean a marketwide recovery is being accompanied by a shift to leadership from blue chip stocks.
Regardless, there are still barriers that will keep any continued bullishness in check. The S&P 500 still seems stuck under the support-turned-resistance line that extends all the way back to 2023 (yellow, dashed on the weekly chart below), while the S&P 500 Volatility Index (VIX) is back near an absolute floor around 14.0 that tends to limit its potential upside.
S&P 500 Weekly Chart, with VIX 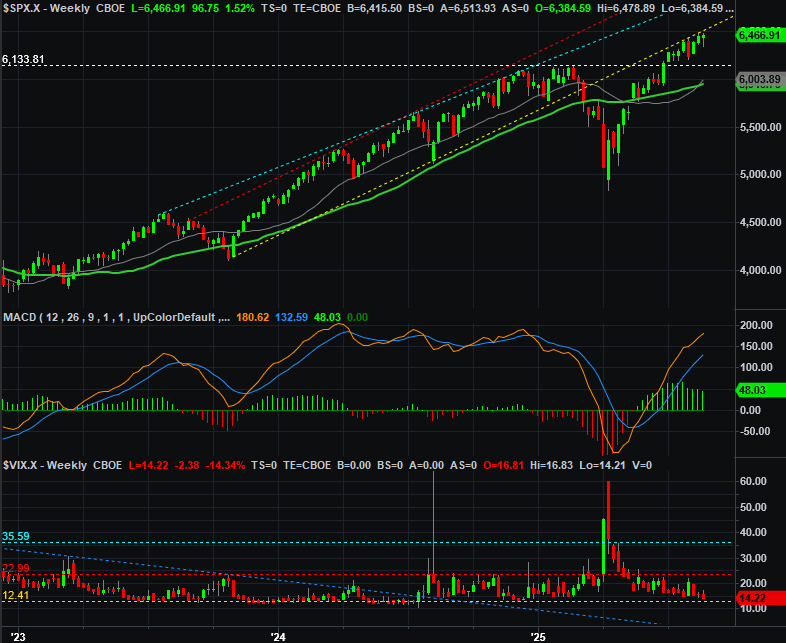
Source: TradeNavigator
And as we explained last week, there would be some benefit to the market going through the setback it usually suffers around September. It would set up the year-end rally we tend to see beginning in the middle of October. As it stands now, there’s not a lot of room left to add the usual year-end gains. The cool part is, there’s still a ton of technical support below to bring a reasonably quick end and reversal to any such selloff.
But first things first. Let’s see if there’s any real willingness to continue Friday’s bullish romp. Based on the fact that the market’s seemingly been upended a couple of times since late July -- even if not for very long -- we remain hesitant to have faith in Friday’s gain.