If you think all chart-based signals are straightforward and crystal clear. Sometimes -- maybe even most of the time -- a great buy signal requires some interpretation and assumption rather than a black and white cue. [If trading was easy, everyone would be doing it. Right?]
Against that backdrop, this week our Afternoon Channel Trader advisory service banked a healthy 42% gain on some Visa (V) calls. While we're obviously thrilled with the win our subscribers enjoyed with the trade, what we really like about the trade is the chart. A look-back and what prompted the trade in the first place is a good lesson in how patterns and chart shapes are just as important as quantifiable indicator-driven trades... and may more important, in some cases.
The option in question was the Visa September (monthly - 09/15) 95 calls (V 170915C95), which would have expired in the middle of the coming month.
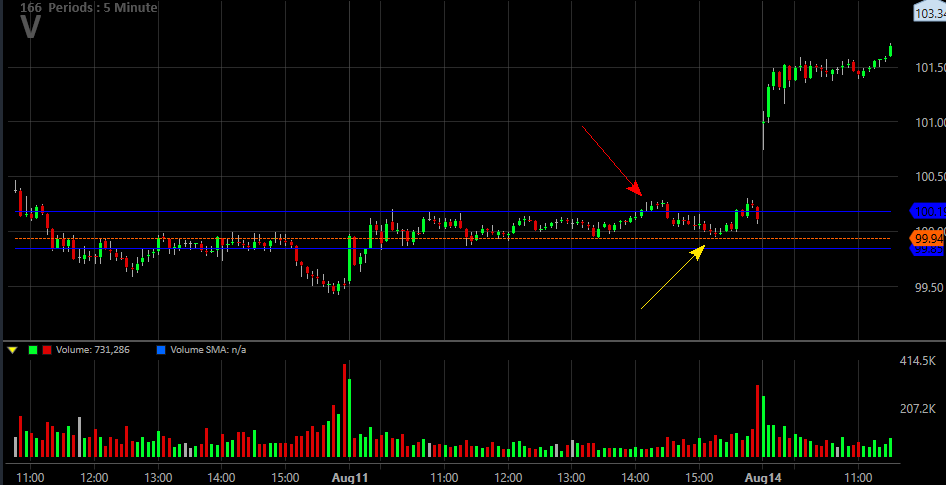
As is usually the case, there were multiple things working in favor of V, but we want to start with the overarching signal... the way Visa shares looked like they were just moving sideways in a narrow range, but were actually building up a breakout thrust. As crazy as it may sound, you would have had to be looking at a five-minute chart to fully appreciated -- and see -- what was going on.
We got into the trade at 3:15 pm on Monday, the 11th, so we had almost the whole day's worth of trading to use to make our decision. And what we saw by that time was a sideways range (framed by blue line) that was slowly giving way. V shares poked above the upper edge of that ceiling shortly after 2:00 pm EST that day (red arrow), and when it peeled back, it didn't slide all the way back to the lower edge of that horizontal range. That pullback was stopped and reversed before it got there, turning around where it hit a low around 1:30 pm EST that day (yellow arrow). That reversal point also happened to be a technical ceiling (orange line) the day before, so it meant even more as a floor now.
Yes, Visa shares rolled over just a bit very late in the day, but the message had already been sent -- the bulls were testing the waters. We saw it by virtue of higher highs and higher lows over the course of that day.
The real lesson here, though, is what coiled the spring that sprung open the next day. Not unlike a slingshot has potential energy when it's pulled back that turns into kinetic energy (motion) when it's released, the day's worth of sideways action was a chance for the bullish breakout potential to get boiling hot. That energy was released the next day, but the lid start to rattle off the pot the day before.
All that being said, the intraday chart is only part of the story. There was also a decent bullish argument on the daily chart. That is, Visa shares crossed under the 20-day moving average line the day before we entered the trade, but fought its way back above the 20-day line the day we entered the bullish/call trade.
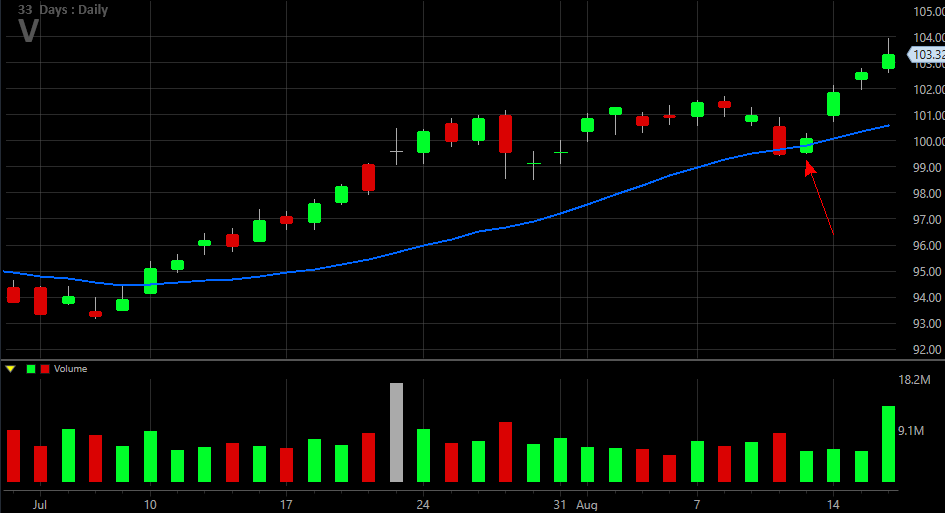
It's a small sign, but an important one. The cross under the 20-day moving average line the day before was a prime opportunity for the bears to deal a death blow. Their failure to do it speaks volumes.
These things are all very subtle, and in and of themselves don't necessarily make for bulletproof trading clues. Together though, they collectively make a big difference. That's what we've always recommended getting a second opinion... particularly one from a different timeframe.
If you'd like to learn more about these trading nuances and "learn while you earn," our Afternoon Channel Trader newsletter is a great opportunity to do so. The service is designed to not force you to watch a computer screen all day. Go here to learn more.