BigTrends.com Weekly Market Outlook - Can The Rally Continue?
Weekly Market Outlook - November 21, 2016
Even though the market didn't end the week on a wildly bullish foot, it ended the week with another respectable gain. The S&P 500 (SPX) (SPY) was up 0.8% for the five day span following the previous week's 3.8% gain.... and all of that 3.8% gain came in just the last three days of that election week. Either way, the persistent bullishness has left the S&P 500 within striking distance of record highs. It's still got a bit of a valuation problem, but between the momentum and this bullish time of year, traders would do well to respect the upside potential.
Of course, it never hurts to prepare for an adverse move either... particularly the way the market has been a bit unpredictable for the past several months.
We'll take a detailed look at the near-term possibilities after dissecting the direction the longer-term economic tide is moving.
Economic Data
As difficult as it may be to believe, in between all the post-election banter last week, economic announcements were still being made right on schedule. Most of them point to strength.
The party started on Tuesday with October's retail sales. Consumer spending was up 0.8% overall on a month-to-month basis, and grew 0.5% when taking cars out of the picture. Year-over-year, we saw growth rates on the order of 2% across the board. Consumerism is holding up pretty well despite what otherwise looks like a headwind.
Retail Sales (Year-Over-Year Growth) Chart
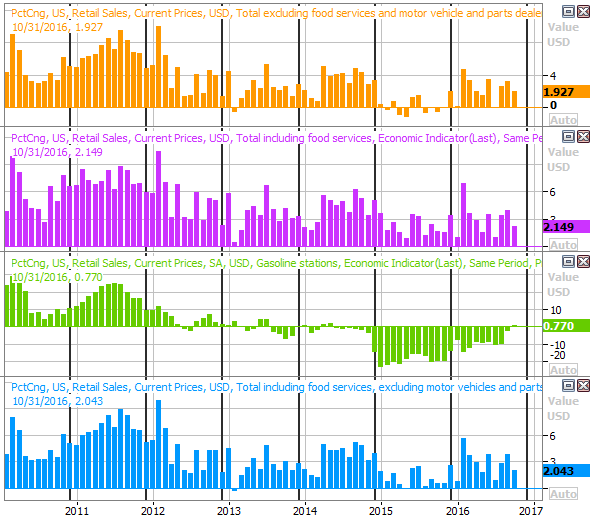
Source: Thomson Reuters
It was also a big week for inflation - there's a healthy amount of it, on all fronts. The Fed's probably going to have to make a move sooner or later, especially with producer price inflation swinging back into positive territory after a two year rut. The benefit of low-cost food and energy has been cycled out and doesn't factor in anymore.
Inflation Rates (Annualized) Chart
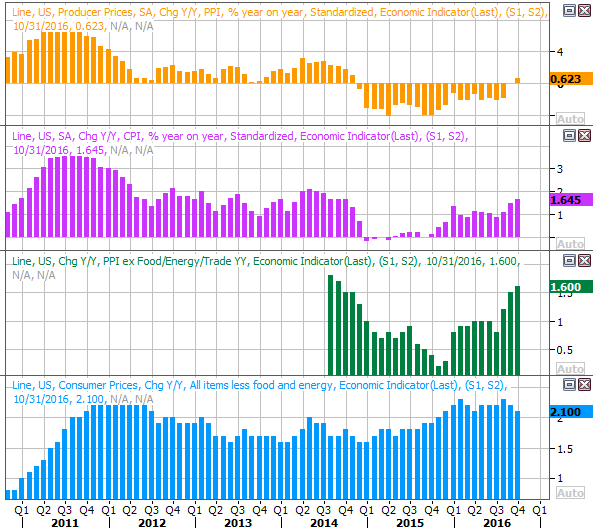
Source: Thomson Reuters
Residential construction, after slowing down in September, roared back to life in October. In fact, housing starts jumped to a new multi-year high pace of 1.323 million units. Permits grew firmly too. The longer-term uptrend is still intact after all.
Housing Starts and Building Permits Chart
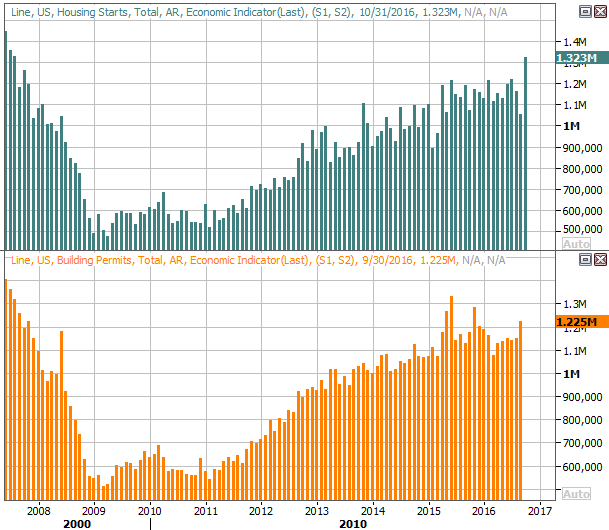 Source: Thomson Reuters
Everything else is on the following grid:
Economic Calendar
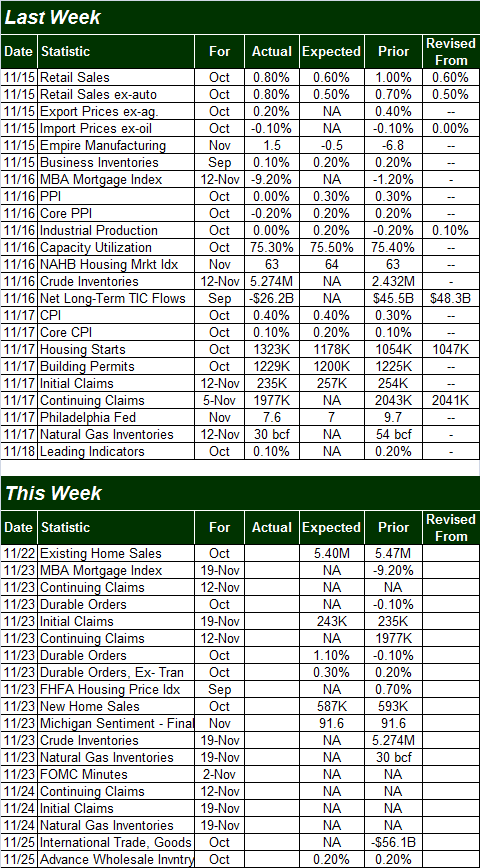
Source: Briefing.com
This week is going to be another busy week for real estate, with the existing home sales report coming on Tuesday, and new home sales due on Wednesday. These trends have been positive, not just in terms of increasing activity, but limited supply.
New & Existing Home Sales Chart
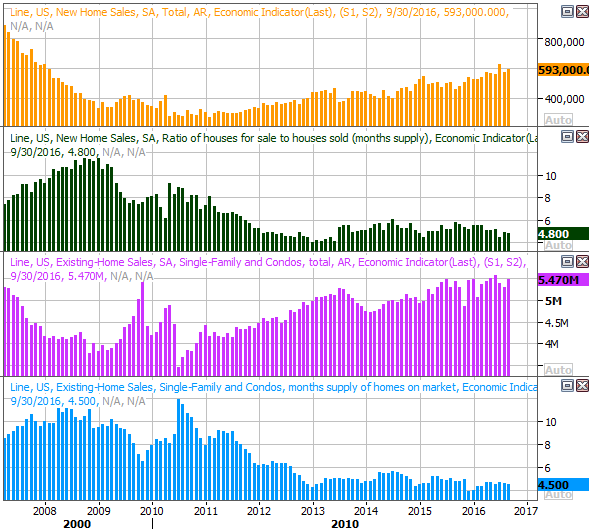
Source: Thomson Reuters
We'll hear October's durable goods orders on Wednesday as well, which could move the market. An even more potent market-mover due on Wednesday, however, is the release of the minutes from the most recent Federal Reserve meeting. The market is sure to scour them, largely looking for some sort of confirmation that the Fed is indeed thinking hawkishly headed into its December decision.
Stock Market Index Analysis
It's not entirely surprising the rally started to slow down when it did. When push came to shove as the prospect of a move into record-high territory approached, the bulls started to have second thoughts. That's not to say the market can't rekindle the rally effort and break above that ceiling. It is to say, however, higher highs aren't a foregone conclusion.
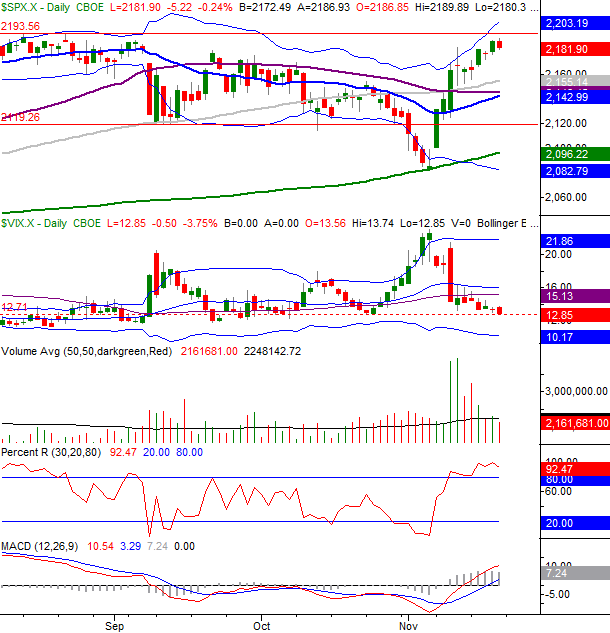
Take a look at the daily chart of the S&P 500 below. It's plain to see the buying interest faded as the August's all-time peak around 2194 came into view. Maybe it was the weekend that slowed things down. Maybe it was the fact that Friday was an expiration day, and kept a collar on things. Whatever the reason, the market will now have to prove the rally was for real - and will last - rather than benefit from blind faith spurred by momentum.
S&P 500 & VIX Daily Chart
Chart created with TradeStation
If the NASDAQ Composite (COMP) hadn't done the exact same thing, it might be easier to assume the S&P 500 was still in rally mode, and just taking a breather. The NASDAQ did the exact same thing the S&P 500 did, however. That is, once its record peak near 5350 was brushed on Friday, the sellers started to dig in.
NASDAQ Composite & VXN Daily Chart
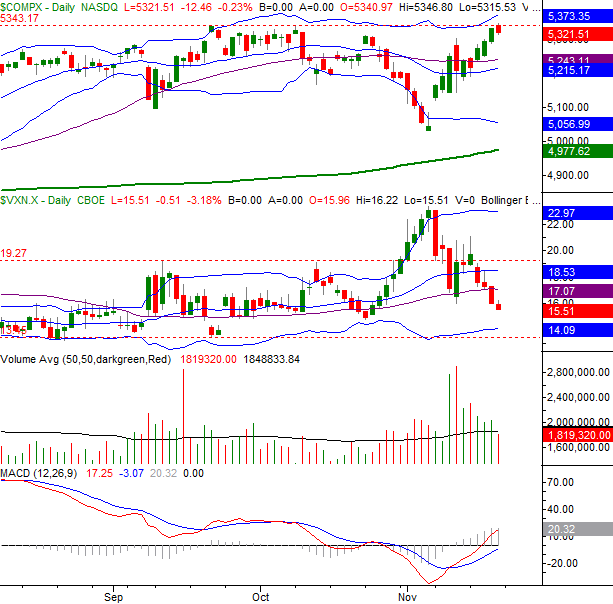
Chart created with TradeStation
Again, maybe it was just the circumstances.... option expiration, the weekend before a holiday week, etc. If so, the rally may well be rekindled this week. We don't know if that's going to be the case though. Right now, we have to prepare for both possibilities.
There's is one bullish nuance here - the Nasdaq Volatility Index (VXN) and the CBOE Volatility Index (VIX) (VXX). Both have developed downtrends, and both have room to keep falling before major floors are met. It's not a lot of room, but there's enough room between here and there to get the indices above their aforementioned ceilings. Once those hurdles are cleared, it gets easier to remain above them. That's not a guarantee, but it's a better likelihood. Making such a bet before it happens is terribly risky.
Just for a little added perspective, take a look at the weekly chart of the NASDAQ Composite. In this timeframe we can see how persistently the bulls have been testing the ceiling around 5350. We can also see how little room there is before the VXN finds a major floor around 11.1. Note that the composite can rally even while the VXN is at rock-bottom lows, though it doesn't rally well.
NASDAQ Composite Weekly Chart
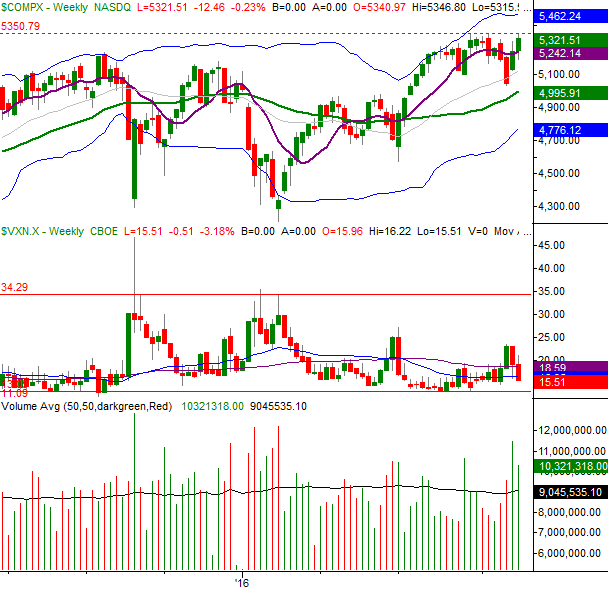
Chart created with TradeStation
With all if that being said, know that very little of what's going on now is based on actual fundamentals, and that can make for an unpredictable market. Right now, investors are digesting the election of Donald Trump, the prospect of rising interest rates, the impact of a rising U.S. dollar, and what looks like budding inflation. The trouble is, interpretations of those things are constantly in flux, and can stop and turn on a dime.. With a general lack of clarity across the board, more than anything else, traders AND investors need to remain nimble here.
Trade Well,
Price Headley
BigTrends.com
1-800-244-8736