Beneath a calm surface, the stock market is undergoing a major change

- Falling correlations could make life easier for active managers -
By Ryan Vlastelica, MarketWatch
[Editor's note: The S&P 500 closed down 0.55% on Wednesday, following the Wednesday morning publishing of this commentary. That sizeable loss ends the very streak Vlastelica was discussing. The point, along with several others, are still worth making though.]
If there’s one word that would seem to describe the U.S. stock market in 2017, it’s this: quiet.
Volatility has been essentially absent from Wall Street this year, with the CBOE Volatility index (VIX) trading near record lows and rarely getting close to its long-term average. Major indexes, meanwhile, have mostly ground higher in an uninterrupted fashion. The S&P 500 (SPX) has hit dozens of records throughout the year, but there have only been eight sessions where it closed with a move of at least 1% in either direction, an atypically low number.
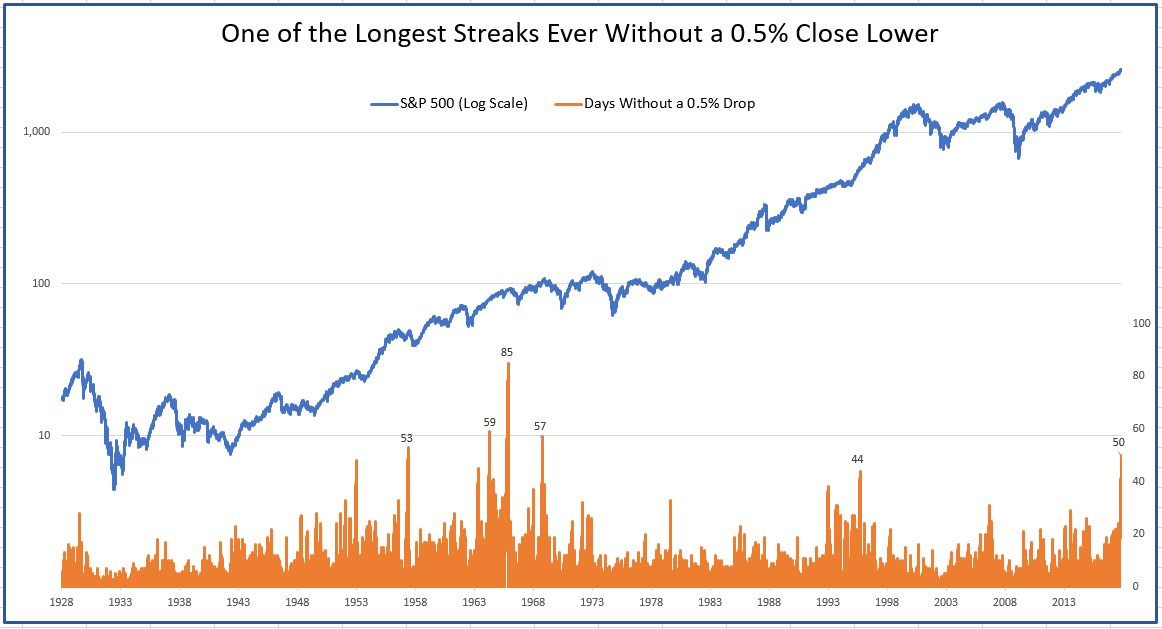
The benchmark index also recently set a record for how long it has gone without a decline of 3%, and as of November 14 it hasn’t closed with a drop of 0.5% in 50 sessions, the longest such stretch since 1968, according to data from LPL Financial.
Beneath the daily moves of the major indexes, however, things have been a lot more dramatic, with individual stocks no longer marching in lockstep with the overall market, as had largely been the case for years.
‘Shocked back to normalcy’
“The election of Donald Trump shocked U.S. equity markets back into normalcy,” wrote Nicholas Colas, co-founder of DataTrek Research. “Before November 2016, U.S. equity sector correlations were stubbornly high.”
Correlation refer to the degree to which two different securities move in tandem. Some pairings—for example, energy stocks and the price of crude oil—tend to be highly correlated, though it is less common for individual stocks to follow the moves of a broad index for an extended period, as opposed to moving on their own fundamentals.
Over the past 10 years, however, correlations have been notably high as the recovery from the financial crisis was seen as a rising tide that lifted all boats. Per DataTrek’s analysis, average sector correlations were 81% between 2012 and October 2016. Last month, however, they came in at 37%, the lowest level since the crisis.
“Given both President Trump and the Republican Party’s high profile stance on deregulation, I assume equity markets see the current government as one more conducive to differentiated economic outcomes,” wrote Colas.
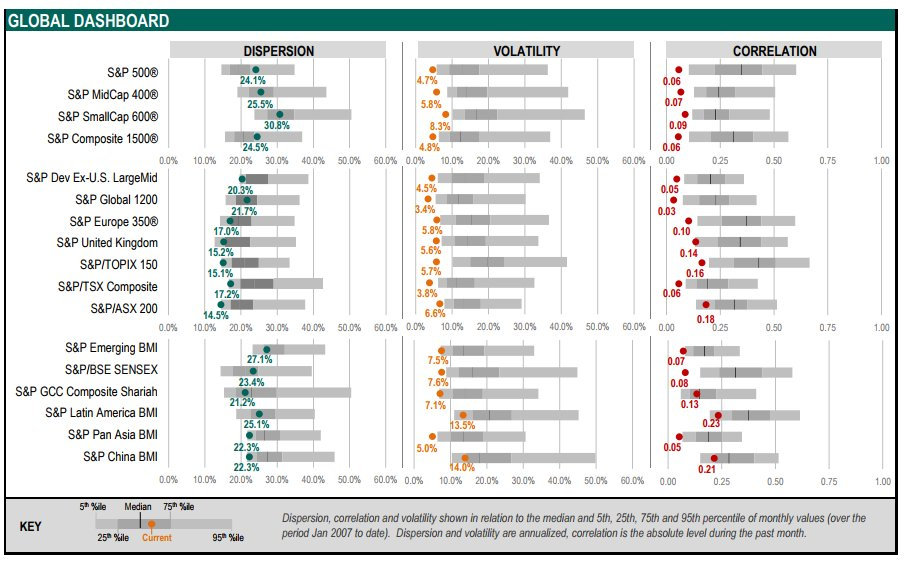
According to data from S&P Dow Jones Indices, correlation for the S&P 500 was at 0.06 in October. A reading of zero would indicate no correlation whatsoever, while a reading of 1.0 would represent perfect correlation between the index and its underlying securities.
“October’s average correlation among the S&P Global 1200 constituents was the lowest in at least a decade, while index volatility in seven out of the 18 indices included in our report also recorded 10-year lows,” the report read.
In a notable example of individual security divergence, Dow component General Electric Co. (GE) has tumbled more than 43% thus far this year, compared with the 18.5% rise of the blue-chip average (DJIA). (The S&P 500 is up 15.2%.)
Boon for active managers
One byproduct of a market with lower correlations is that it could become easier for active managers—who build portfolios by individually selecting securities—to deliver better performance than passive funds, which mimic indexes by holding the same stocks they do, and in the same proportion. Active performance has been dire over the past decade, with few managers able to consistently beat a market rising so broadly and consistently.
Due to the poor performance and higher fees of active funds, relative to their passive equivalents, investors have been heavily moving toward index products. According to data from Morningstar Direct, passive U.S. stock funds—including both mutual funds and exchange-traded funds—have seen net inflows of $27.56 billion thus far this year, while active funds have seen outflows of $18.8 billion.
This trend has raised some concerns, with critics of passive investing arguing that if every investor is buying the same stocks in the same proportion, that will lead to individual securities being priced incorrectly, as they wouldn’t be evaluated on their fundamentals. Robert Shiller, the Nobel Prize-winning Yale economics professor, compared passive investing to “free-riding on other people’s work” in an interview with CNBC earlier this week.
“The strength of this country was built on people who watched individual companies. They had opinions about them. All this talk of indexes, it’s a little bit diluting of our intellect. It becomes more of a game,” he said.
Passive investment comprises about 35% of the U.S. equity market, up from 15% in 2002, according to data from Toroso Investments Research.
The falling correlations, as they’re coming at a time of high passive inflows (and sharp active outflows), diminishes this argument. Active managers, in theory, now have better odds of finding undervalued names or otherwise positioning to take advantage of what Colas called “differentiated economic outcomes,” doing better than the overall market as a result.
There are signs this has already begun. Per Morningstar, 10 of the 12 asset-class categories the firm tracks had more active managers outperform their underlying index this year compared with last year, while a majority outperformed in eight of the 12.
“For the past five years, the value provided by active and sophisticated asset-allocation strategies relative to passive and simple ones seem to have vanished,” read a research report by Hermes Investment Management. “Our analysis suggests such that value is cyclical and tends to be higher during market inflection points. Therefore, in the context of asset allocation, a comprehensive shift to passive strategies would carry the risk of being shortsighted.”
‘Secret sauce’
Another byproduct is that market volatility could stay low as long as correlations are diminished.
“Correlations are the ’secret sauce’ in equity market volatility,” Colas wrote. “When correlations are high, volatility will be elevated because sectors tend to trade in the same direction. When sectors move more independently, actual volatility will drop (everything else equal) as marginal winners offset losers.”
He added it would be difficult for the VIX to rise so long as correlations stay at their current levels. “Bottom line: stop waiting for the VIX to drift back up to 15 or 20. Absent a shock, that’s not going to happen any time soon.”
From MarketWatch