Amazon.com (AMZN) Shares At the End of a Head and Shoulders Pattern
It may be up today (Tuesday), but Amazon.com shares began waving some serious red flags late last week, and the stock is hardly out of the woods yet.
Feel free to put the stock on your watchlist of potential trading ideas; this one obviously has short/bearish potential. That's not why we're interested in taking a closer look at it for you today, however. It's worth dissecting on Tuesday simply because it's a pretty good example of a rarely-seen but very noteworthy chart pattern that makes AMZN so vulnerable right now.
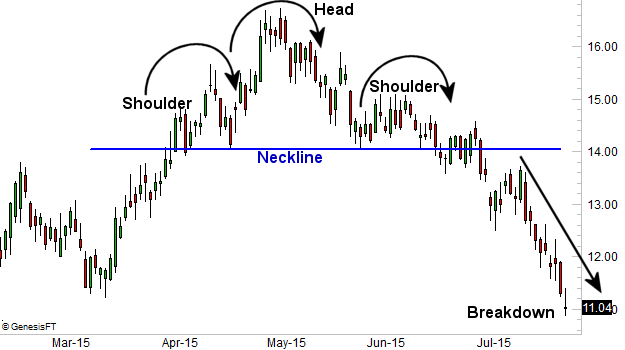
Ever heard of a head-and-shoulders pattern? If you've been trading for a while, you probably have. If not, it's simple enough. A head-and-shoulders pattern is characterized by three humps, or surges, in a row, with the middle hump -- the "head" surrounded on either side by a "shoulder" that peaks below the high of the "head." The neckline, or the low after all three peaks, should be more or less a straight line, serving as a make-or-break support level for the possibly-doomed stock.
As is almost always the case, it all makes much more sense with a visual example. Amazon shares are providing that example for us quite nicely.
The neckline in this case is $949.74, give or take. That's been the average low for the three peaks that have taken shape since early June. Perfectly? No, but nothing ever is. As far as technical support goes though, that line in the sand is defined more than well enough. The real story on the chart of AMZM, though, are the three peaks. The outer two are the shoulders, and the middle one is the head. With that pattern in place, the next decisive move under the neckline at $949.74 could open the selling floodgates wide open.
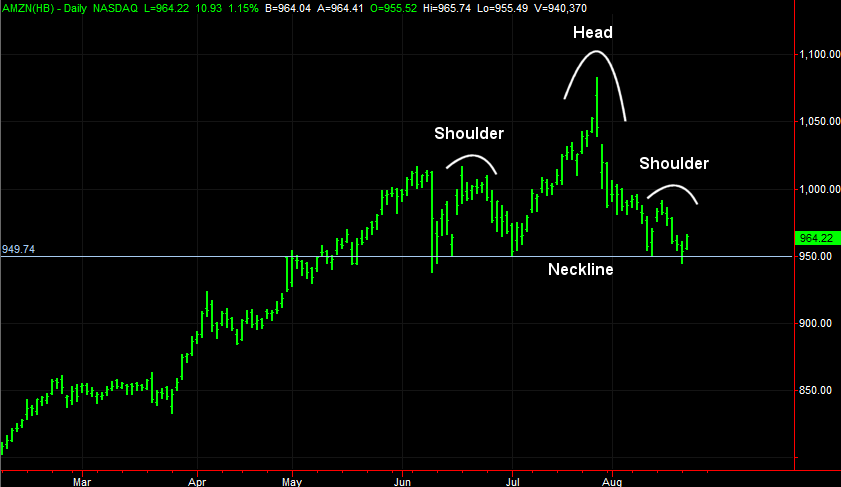
A perfect example of a head and shoulder pattern? No, but it's a pretty good one... about as good as one can expect to find in the real trading world.
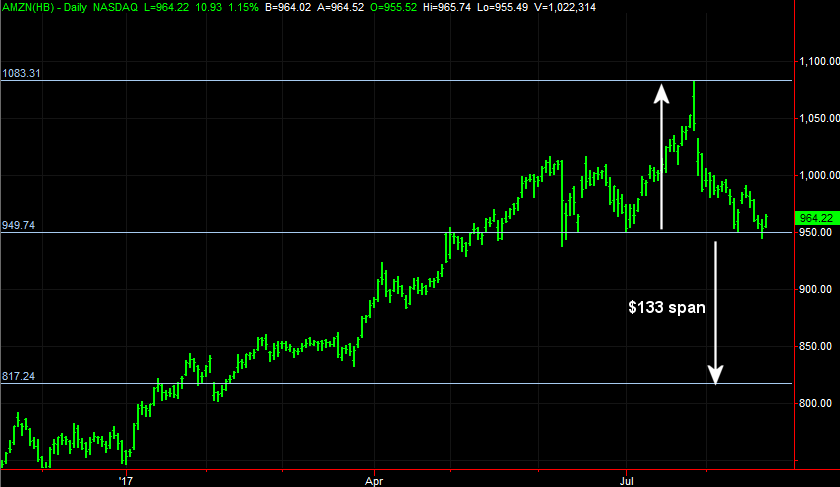
On that note, one of the lesser discussed nuances of head and shoulders patterns is using them as a means of setting a downside target for if and when the neckline breaks down as support.
Though like any aspect of trading there are never any guarantees, the average pullback once the neckline is broken is more or less the same distance between the neckline and the top of the head. In this case, the peak of the head is at $1083. Between there and the neckline at $950 is a $133 point span. Subtracting $133 from the neckline at $950 would drag AMZN all the way back to a low of $817, give or take. That's where Amazon shares found some turbulence early in the year.
Again, it can't be stressed enough that the market and its stocks are randomly-moving beasts. While their history can provide important clues as to their likely future, that future is never set in stone. At the very least though, chart patterns and tendencies help provide a trading framework for you when there is no evident trading framework. At the very least these themes are a starting point to make sense of a chart.
We may or may not issue a trade on AMZN in the near future based on the pattern. But, if you'd like to see how we handle this or other opportunities, sign up for one of our trading recommendation newsletters today. Members love the fact that they get to earn while they learn, as we walk them through specific, actionable ideas, and follow those trades through to their eventual exit (which are aslo made with explicit instructions.)