Actually, Wednesday's Weakness Isn't "Panic" Selling at All (which is the scary part)
With nothing more than a quick glance at Wednesday's market action, and headlines, it's not difficult to connect the dots. Renewed (and ramped-up) trade war chatter undercut stocks, which were overbought to begin with. That was the only cause, and this was the only possible outcome.
That's a viewpoint, however, that doesn't hold up to scrutiny.
Reality: Traders never really believed in this budding rally anyway. Not only was participation in the gain from last week - after returning from Wednesday's 4th of July break - never all that strong, that participation was nil on Tuesday despite the seemingly bullish effort.
Until there's enough conviction to keep a rally effort in motion, it may not be all that fruitful to step into what looks like the early stages of a rally.
There's more than one piece of empirical evidence that makes the point; we'll start with the most convincing one.
The image below will be one that regular readers of BigTrends commentary should recall. It's a comparison of the S&P 500 to the market's overall "up" volume and its overall "down" volume. The inherent flaw in the rally effort since last Thursday becomes immediately clear. The index may have been moving higher, but there was never any real bullish volume behind the move. In fact, the "up" volume levels were sub-par. It's a problem, simply because volume needs to grow with a trend, if it's to last.
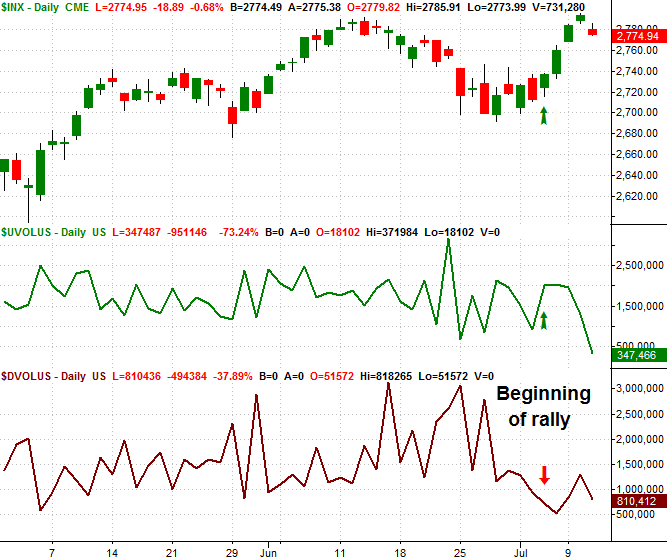
To be fair, there wasn't a lot of bearish volume during that recent bullish move. In fact, there was considerably less bearish volume then there was bullish volume for that stretch. It doesn't entirely matter though. You still need bullish volume to grow.
Yet, the real warning that Wednesday's trading may use more than its fair share of red ink materialized on Tuesday.
You may have to look very, very closely to see it (squint a little, if it helps), but despite Tuesday's gain, we actually saw more bearish volume than bullish volume that session. It's not charted here, but it's also worth knowing that on Tuesday, there were more declining stocks than advancing stocks. It's just that enough of the right stocks that carry more than their fair share of weight managed to wrestle the S&P 500 higher. That's not a nuance that can last indefinitely though.
It's not just breadth (advancers/decliners) and depth (up volume and down volume) that have been waving red flags though. Traders have been quietly hedging against a pullback for a while now, even as they were buying stocks.
Hedging isn't in itself a misguided activity. Indeed, it's very much a "smart money" move. Thing is, most people don't actually do it unless they have good reason to think a rally is going to fade, or outright implode.
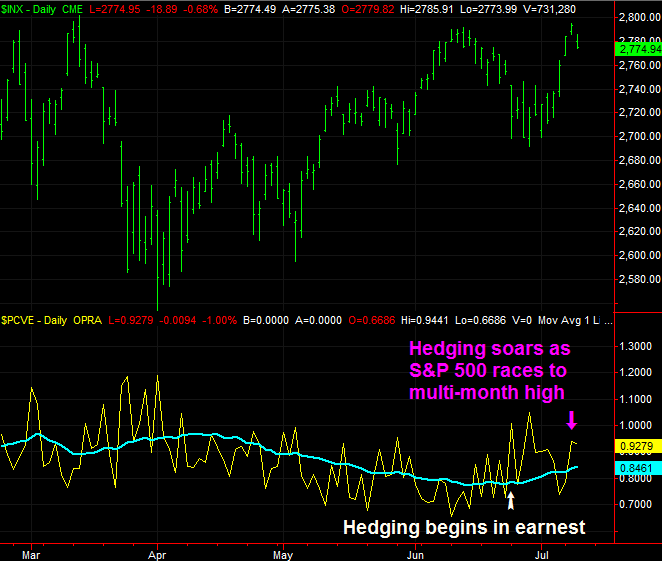
There are several tools we can use to denote hedging activity, but one of the simplest and most straight-forward ones is an analysis of the put/call ratio. It's a simple ratio that compares the number of bearish put options traded on any given day to the number of bullish call options traded that same day. When you start to see more puts changing hands than calls, you can know traders are becoming increasingly uneasy.
The raw daily data is too erratic to use, however, so to smooth it out into a discernible trend, we apply a moving average of that data. That's what appears on the bottom of the graphic below... a moving average of the market's put/call ratio.
As you can see, traders started to buy lots more puts in late June - something they really hadn't done a lot of since March, despite plenty of pullbacks in the meantime. They cooled off with the put-buying a bit in early July, but even as the S&P 500 was racing to new multi-month highs on Tuesday, traders were betting beg-time against the market again using put options.
One can't help but wonder if (as the rising moving average line suggests) traders have been thinking bearishly since mid-June, even if the market itself wasn't always acting bearishly. If so, then the rally never really had a chance of surviving. Traders already had it in their heads stocks would tumble. It was only a matter of time before they found an excuse to make it happen.
It's still not etched in stone. Nothing is, in this environment. To the extent any clue can matter though, these two do. This isn't panic-driven selling. This selling had been planned for a few days. The market just needed a reason to get the ball rolling.
Just be sure to keep tabs on everything else at the same time. As pessimistic as traders have actually, quietly been of late, they can still stop and turn on a dime. And, they probably will. The trick is simply being able to read ALL the tea leaves, and recognizing the difference between a short-term trend and a long-term one. Buying the dips has been a good strategy of late, as has been selling the rips - a perfect environment for options trading. Digging in for the long haul, conversely, hasn't helped much. Both tools/charts above are great short-term tools that can not only help you get in at the right time, but keep you out of trouble.