A Test is Brewing, But Don’t Overreact to its Arrival (It’s the Little Things)

The 10% rebound since Christmas, if most traders are being honest with themselves, came as a bit of a surprise. Indeed, even more surprising is that despite a nasty tumble on Thursday, January 3rd, didn’t kill the budding rebound effort. The buyers came back more convinced than ever the very next day to carry stocks to even higher highs.
Now, fearing they’ll miss out on any more upside, the late-comers are finally starting to file back in. They probably shouldn’t, given the subtle clues that have been taking shape for the past several days.
Subtle Market Clues
It’s admittedly a confusing time for traders. The market was in a freefall in the middle of December, and the explanations not only made sense, they sounded like they would persist. The rebound in the meantime wasn’t supposed to happen. Yet, with stocks on the rise, at least a small handful of pundits are now talking about buying opportunities.
While frustrating, it’s not surprising to veteran traders. Sometimes the market behaves rationally. Other times it’s pushed around be relatively irrational sentiment. In retrospect, December’s drubbing looks to be the latter of those two possibilities.
That’s not a call for more bullishness though… at least not yet.
It’s difficult to keep tabs on them, and even more difficult to believe them when emotions are high, but the market will drop subtle hints to those willing to look for them. And right now, despite the renewed rally, there are hints that the uptrend is running out of gas.
The hints are evident in multiple forms, but two of the biggies are clear just with the chart of the S&P 500 we use with our Weekly Market Outlook.
VIX Stopped Moving Lower
Take a look. Specifically, notice how the VIX has not only stopped moving lower, it’s toyed with the idea of moving higher again. The so-called smart-money isn’t entirely convinced there more additional upside without suffering a little downside first. Also on this daily chart of the S&P 500 we can see that despite the strong rally, the buying volume behind the rally has been below average. It’s not been poor, but it needs more participation if it’s to last.
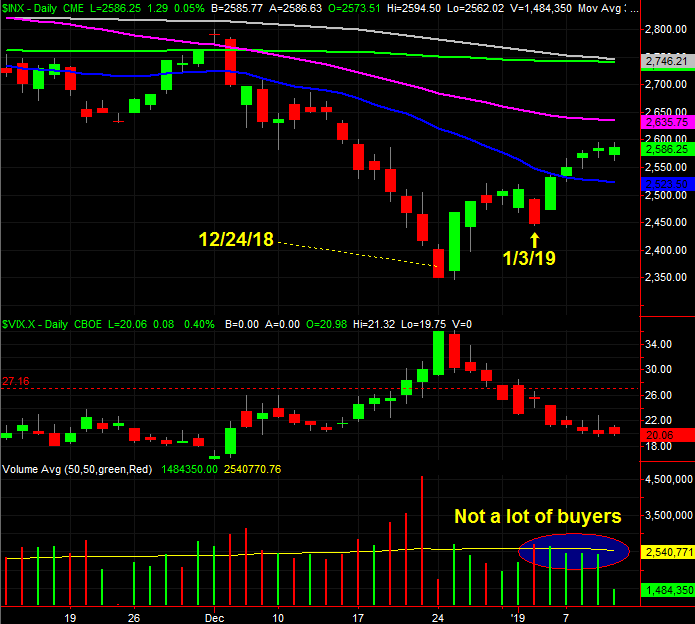
That said, it’s not difficult to see the S&P 500 itself is slowing down.
Don’t read too much into the subtle hints. While more and more would-be buyers are backing away, this is far from convincing evidence the rebound that got rolling in late-December will end up falling apart. It may just need a brief break before resuming. At the very least, Monday’s cross back above the 20-day moving average line (blue) should be respected.
Bullish Volume vs. Bearish Volume
It’s also worth noting that since the Christmas pivot, the average daily buying volume for is higher than it’s been in over two year. That’s the thicker green line on the graphic below; the thin green line is the raw daily data.
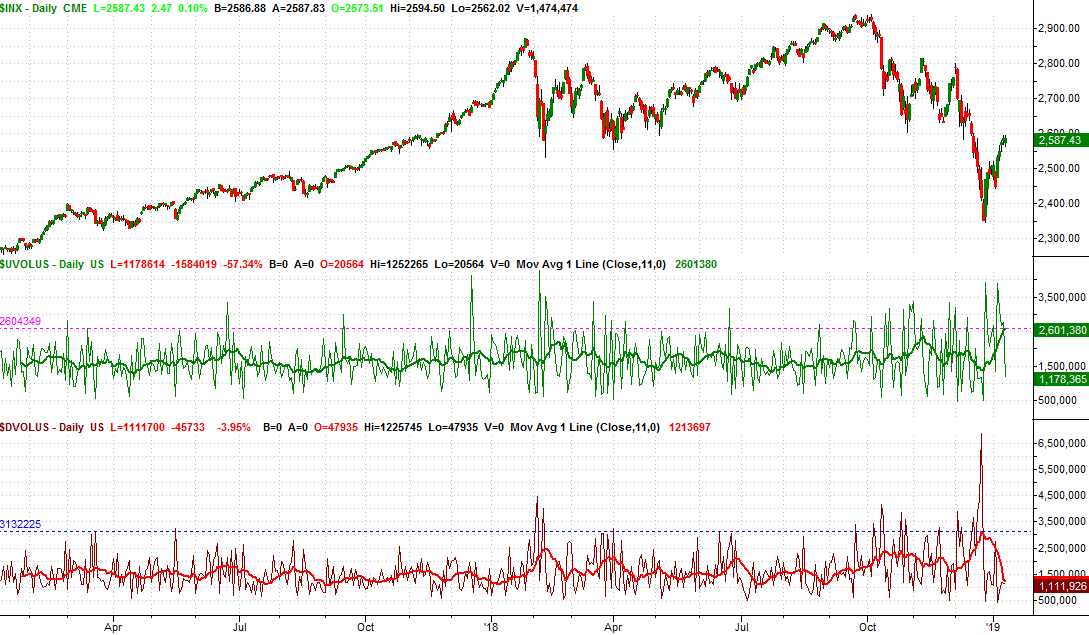
Granted, in the two weeks leading up to the Christmas break, selling volume reached a two-year climax. In some regards it only makes sense that a high-volume bounce would take shape. The point is, however, that the NYSE’s average volume of 2.6 billion shares per day now is almost as strong as the peak average selling volume of 3.0 billion shares per day as of December 24th. Investors are buying these names back in earnest. Maybe not in droves, but in earnest.
Don’t read too much into that bullish hint either. Though it speaks (no pun intended) volumes about the underpinnings of this rebound effort, it won’t necessarily stave off a test. It simply suggests that the S&P 500 will survive that test without taking too much of a hit. A slide back to the 20-day moving average line may be all the breather the S&P 500 needs. The market certainly recovered nicely from its previous stumble back on the 3rd.
Adjust Expectations
This is a challenge for most traders, not because they’re unintelligent, but because they’ve been encouraged to expect massive movement from an “all or nothing” minded media. The reality is, most market moves are very minor, and involve the process of taking one step back for every two steps forward.
Every now and then stocks will dish out something stunning, like the meltdown in the middle of December. Most of the time though, the market’s action is relatively boring, which is exactly when the little clues like the daily volume data and the VIX’s subtle turns help in a big way.
Just as helpful is not acting on every single bullish or bearish though the financial news machine may spit out. Those ‘experts’ tend to sell extremism, and the fine details that matter the most don’t make for good television (or even for good internet).
Near-Term Market Outlook
As for the near-term future, it looks like the current rally has grown tired, but that doesn’t inherently mean the gains since late December have to be given up in their entirety. As was noted above, the S&P 500 may only need to peel back to its 20-day moving average line at 2523 to hit the proverbial ‘reset’ button and rekindle the rally. After that, the 50-day moving average line at 2635 becomes the next test. Just keeping an eye on the VIX and each day’s bullish and bearish volume may be enough to help you navigate that process like a pro.