200 years of US interest rates in one chart
by Amanda Diaz
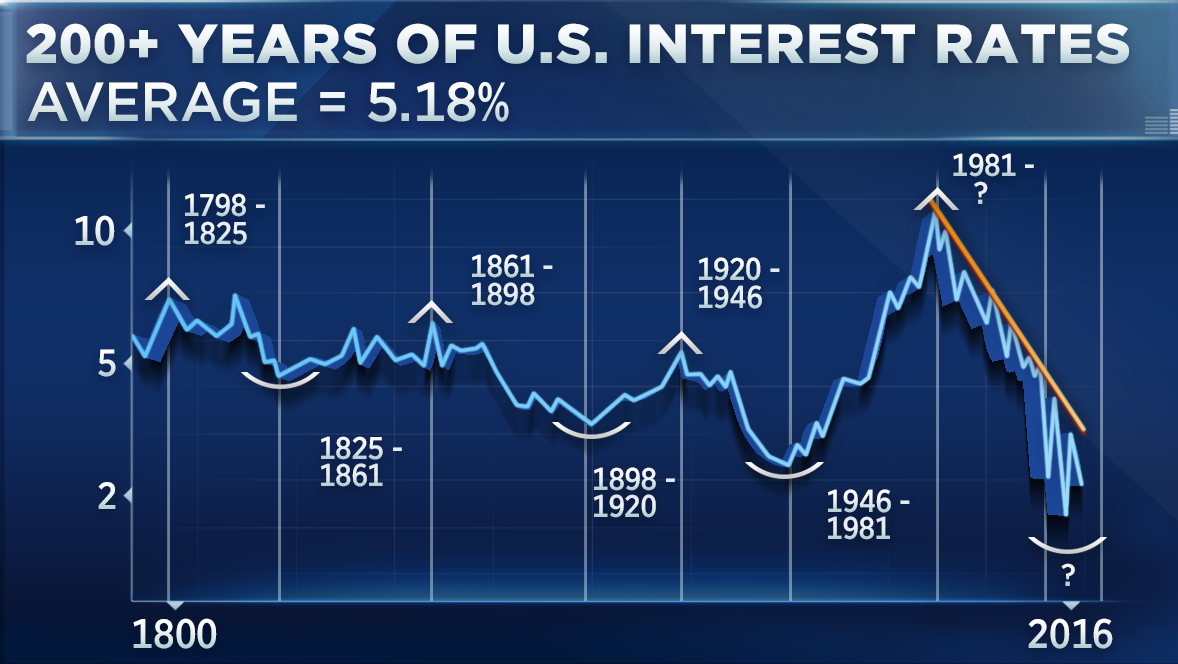
History shows the only place for interest rates to go from here is higher — according to veteran technical analyst Louise Yamada.
Looking at a chart of U.S. interest rates over the last two centuries, Yamada pointed to a bottoming formation that has been in place for the last several years.
"We've been looking at the process that we think has been taking place over the last six to eight years in our interest rates, and we think now that the 2012 low probably is going to prove to be the low just the way 1946 proved to be the low in the last cycle," the head of Louise Yamada Technical Research Advisors said Thursday on CNBC's "Futures Now."
The yield on the U.S. 10-year has surged to 2.3 percent following the election on higher inflation expectations under President-elect Donald Trump and the potential for a Fed rate hike next month.
"I think it would be very healthy [to raise rates]," explained Yamada. "We are definitely watching 3 percent because that's going to be the ultimate level at which we can definitively say that rates have reversed." That 3 percent also corresponds with the 1980 downtrend on Yamada's chart.
"We are looking at the formation of the higher low, and the 10-year note would have to put in place a slightly higher high to define the real technical evidence of the reversal," she added.
Ultimately, Yamada said that higher rates will boost equity prices in the near term, as past cycles have signaled a boom in stocks and the economy.
"The early stage of a bull market can be accompanied by the initial rising rate cycle," she said. "It isn't until you get to about 5 percent that you start having problems."
The S&P 500 closed Thursday within a fraction of its all-time high.
Courtesy of cnbc.com