Gold Near Key Long-Term Fibonacci Support Level
The recent plunge in Gold has been one of the leading talking points among many traders and investors out there for some time. The who/what/where/when/why of the acceleration of the downtrend in Gold ( (GLD) ETF) has been speculated on by many. It is rumored that a legendary investor has lost billions by doubling down on a losing Gold bet during the downtrend (stubbornly doubling down on losing trades is normally a bad proposition in our view). Not to mention the constant chatter of the many Gold perma-bulls, who have been arguing for some time that a bottom or the next upleg is here -- and the Fed policy critics who point to a Gold rally as an inevitable result of global fiscal policy (which may end up being correct in the long run).
However, as we always say at BigTrends, the chart tells the tale (to paraphrase Jessie Livermore) -- and the trend in Gold has largely been down since it topped in late 2011. We've profited on GLD, the Silver ETF (SLV), Gold Mining Stocks, Metals, etc many times in BOTH directions throughout recent years in our ETFTRADR and other real-time option trade recommendation services.
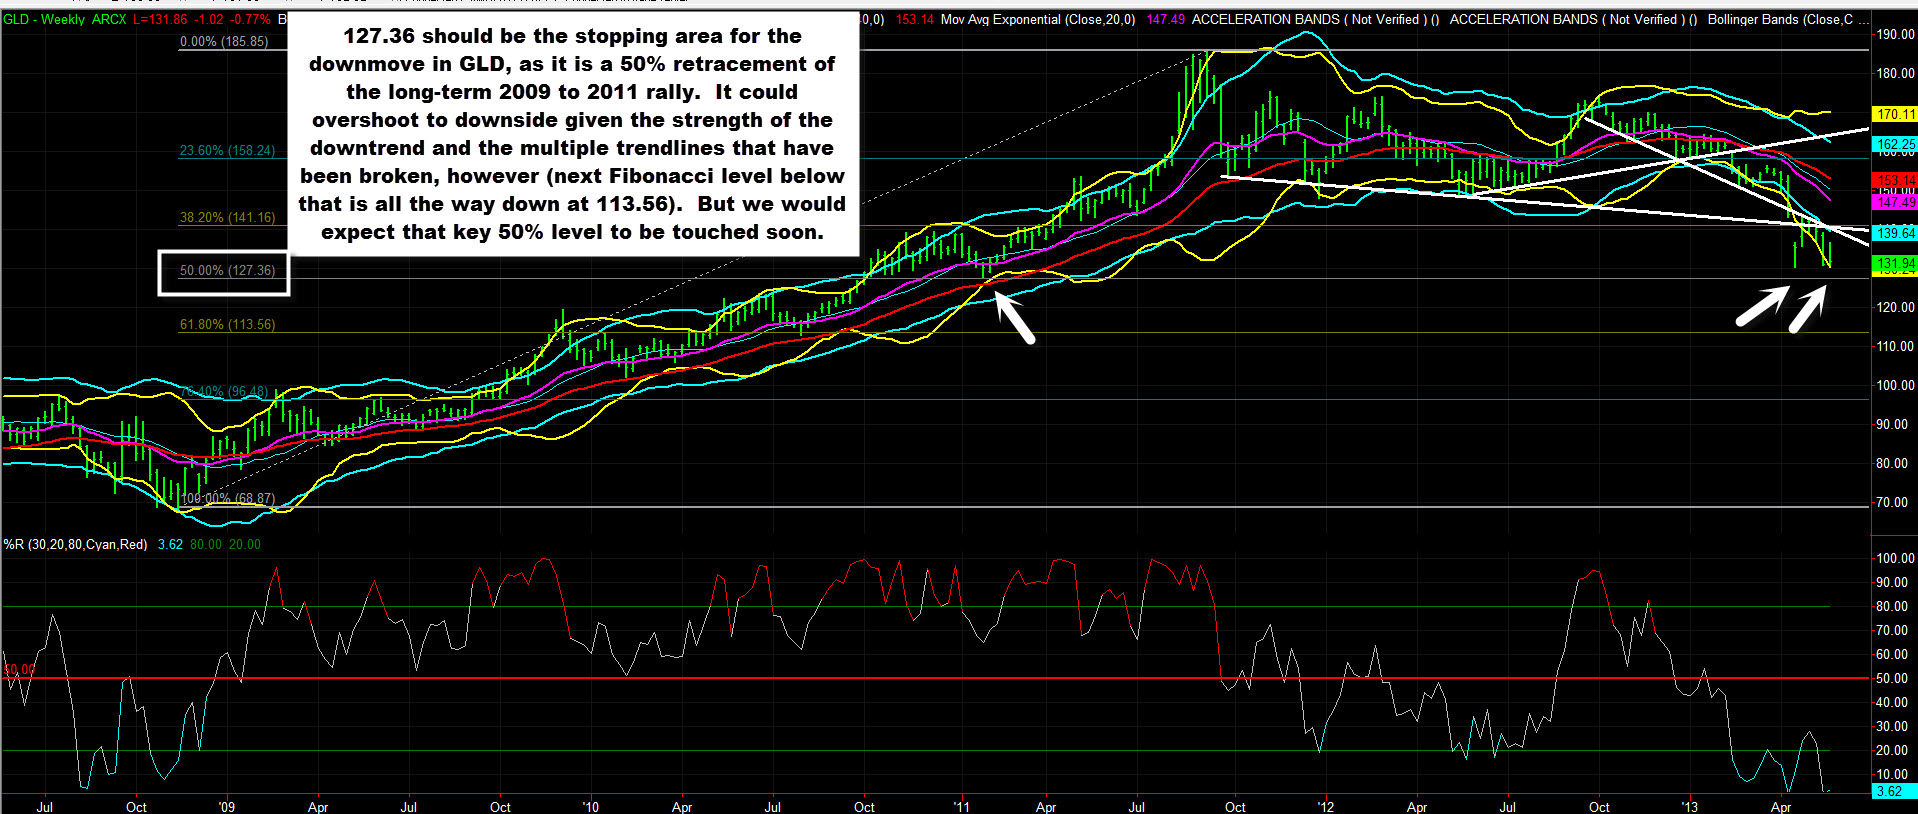
So as I mentioned, we've had no problem riding Gold and other metals downward recently -- but now, amid a cacophony of volatility, a clear picture emerges on the long-term GLD Weekly Chart. Using a Fibonacci Retracement of the 2009 lows to the 2011 highs, we see that a perfect 50% retracement in the old GLD rally is close upon us. If you're not familiar with Fibonacci, it's a mathematical formula and series of numbers created by an Italian mathematician in the 12th century -- Fibonacci patterns and sequences are seen and used in nature, science, astronomy, finance, and many other fields (it occurs so often in nature that is it far from a coincidence). See the chart below:
The 127.36 level on GLD is a 50% retracement of the uptrend -- regardless of whether you see a value in Fibonacci Retracements or not, the 50% one is a logical, key area to pause a trend which we've seen occur time and again. It basically points to the level where a stock has given up half its previous rally. So we are near a very likely area for GLD to pause the downtrend and likely consolidate (a bounce then a re-test of that level is also something that occurs often). If we do overshoot to the downside, that is also within reason given the overall bearish technical picture and the multiple simple trendlines that GLD has violated recently.
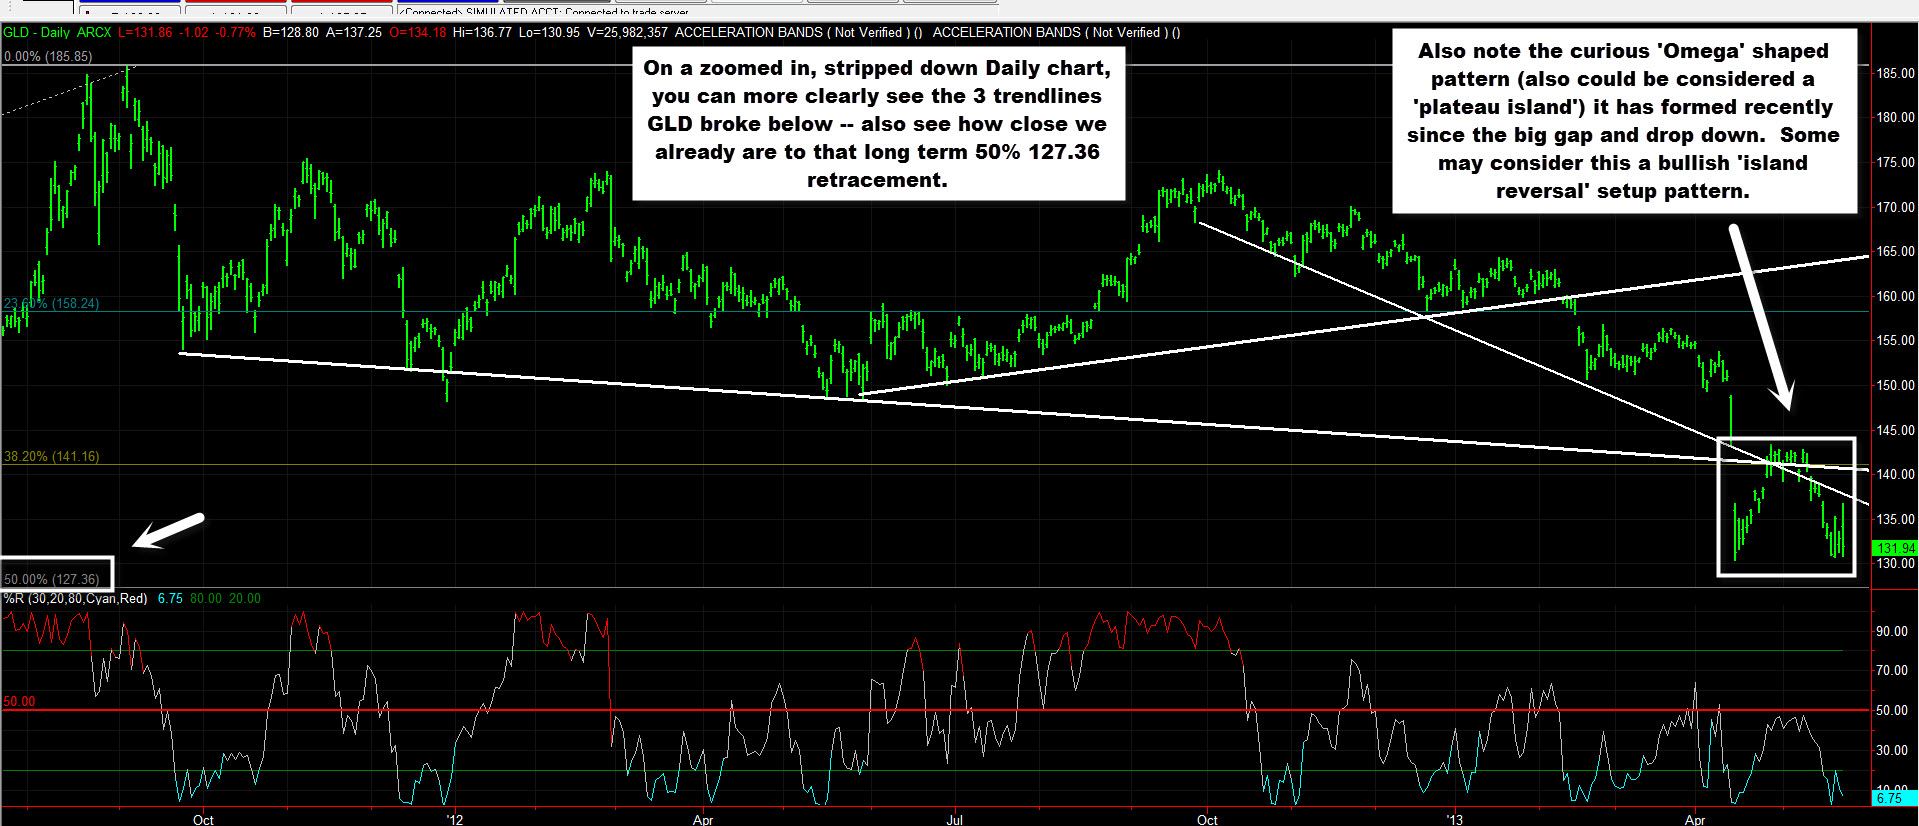
Zooming in to a stripped down version of the GLD Daily Chart will be helpful as well -- see the chart below:
So, above you can see that we've already approached and are near that 127.36 Fibonacci level. Also note how the violation of the trendlines led to more downside. But finally, there is this interesting volatile pattern that's emerged since the big 2 day gap/drop down last month (after the historic 2 day drop in Gold). This technical pattern resembles a Greek "Omega", and looks to be a setup for another big move. Some may view this as a possible bullish island reversal pattern being created -- but it looks like a "volcano" or "plateau" island to me, which is unusual.
It will be interesting to watch how this plays out in the coming weeks and months in Gold -- but definitely keep an eye on that 50% retracement level as a likely bottom for GLD in our analysis.
by Moby Waller
co-Portfolio Manager, ETFTRADR & Rapid Options Income
BigTrends.com
1-800-244-8736


