Will The Nasdaq & Russell 2k Drag The SPX Back Down? - Weekly Market Outlook
Will The Nasdaq & Russell 2k Drag The SPX Back Down? - Weekly Market Outlook
You have to give credit to the bulls - they're not going down without a fight. In fact, last week's market rebound right from the brink of disaster was another impressive comeback. On the other hand, as impressive as Friday's bounce was, stocks still aren't over the big hurdle that's been holding them back since February. Will this be the time we break through past the recent choppiness and trend higher?
We'll draw that line in the sand after recapping last week's big economic news and previewing this week's economic lineup.
Economic Data
There was plenty of economic data in the queue last week, but there was little doubt as to the highlight. April's employment numbers released on Friday was not only the most important news, but was also the prod for the big recovery rally.
It was (obviously) encouraging information. The unemployment rate fell from 5.5% to 5.4% in April, on the heels of 223,000 newly-created jobs (versus only 85,000 new jobs created in March). It was a pleasant surprise compared to the 169,000 payroll-processor ADP says it saw materialize last month. It wasn't so good, however, as to suggest the Federal Reserve was going to accelerate its plans to raise interest rates... not that the Fed has made it clear what its plans are. Investors didn't mind the missing details though. Whatever the Fed's plan is, it's likely not moving ahead any faster because of last month's employment progress.
Employment Trends Chart
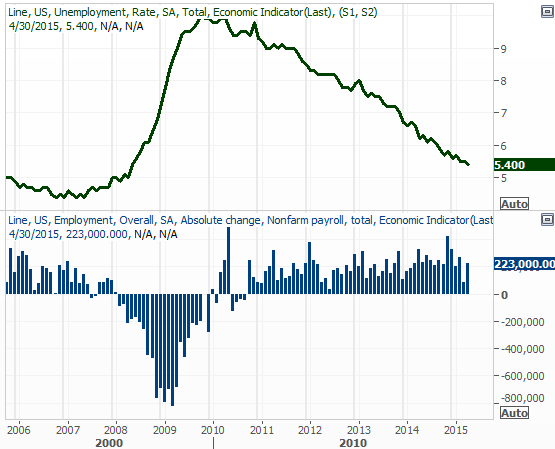
Source: Thomson Reuters Eikon
There were several other pieces of economic data released last week, but the only other one really worth mentioning is March's factory orders. They were up a solid 2.1%... a nice recovery from February's 0.1% dip. In fact, March's progress thwarted a six-month losing streak.
Factory Orders Chart
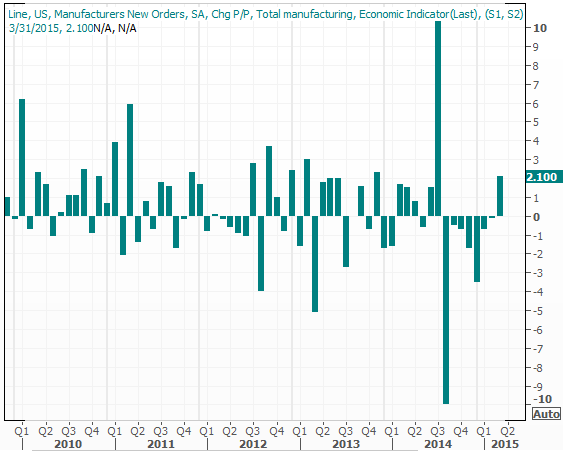
Source: Thomson Reuters Eikon
Everything else is on the following grid:
Economic Calendar
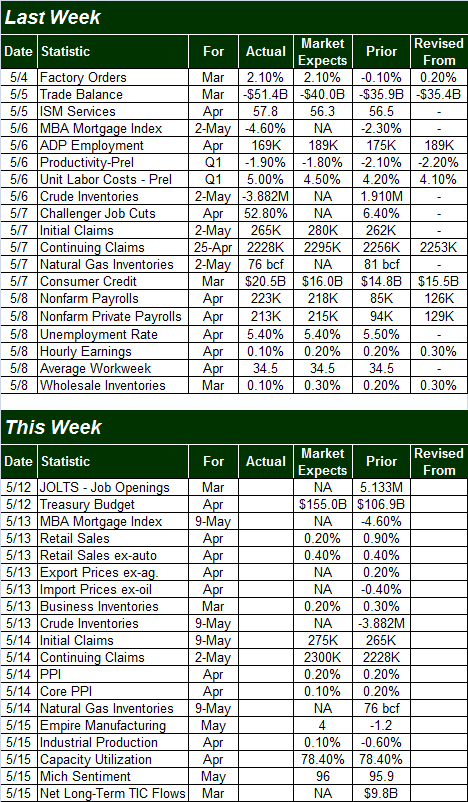
Source: Briefing.com
The coming week is going to be pretty busy again, but two items on the agenda are really worth previewing... Tuesday's retail sales data for April, and Thursday's capacity utilization and industrial productivity data.
Overall retail sales are expected to have fallen from 0.9% growth to only 0.2% growth, while retail sales not counting automobile sales is expected to stay flat with March's 0.4% growth. It'll be interesting to see is slightly higher gasoline prices adversely impacted spending in other areas. Bluntly, we could use a nice surprise on the retail spending front.
Retail Sales Chart
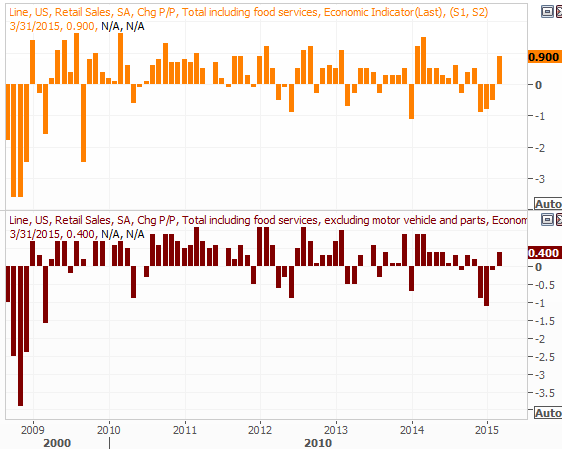
Source: Thomson Reuters Eikon
Though the downtrend in industrial production is expected to reverse modestly (to the tune of +0.10%) for April, it's not expected to make a dent in the capacity utilization rate of 78.4%. As was the case with retail sales, we need a strong showing here.
Industrial Production and Capacity Utilization Chart
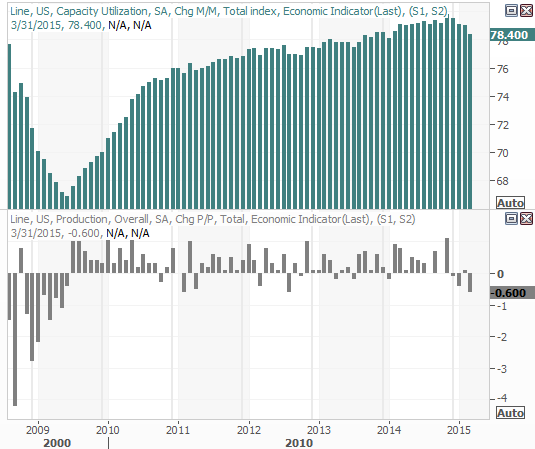
Source: Thomson Reuters Eikon
Stock Market Index Analysis
There's no denying the market finished the week on a bullish note. After pushing off of the lower 20-day Bollinger band on Thursday, the S&P 500 (SPX) (SPY) broke back above all of its short-term moving average lines on Friday to retest a huge ceiling at 2118. By the time the closing bell rang, we had a bullish Percent R situation again.
S&P 500 & VIX - Daily Chart
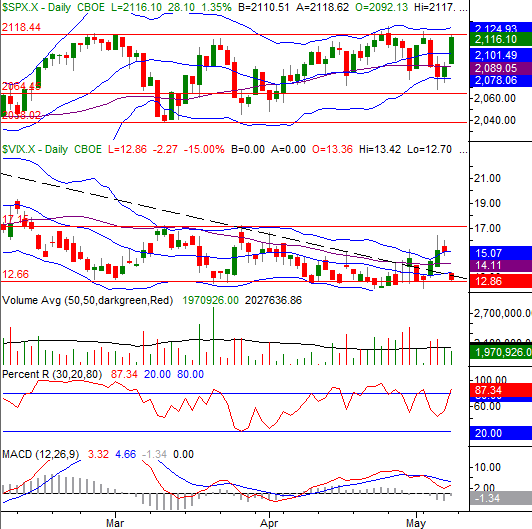
Chart created with TradeStation
Also note how the CBOE Volatility Index (VIX) (VXX) imploded on Friday, coming back from the 16 area all the way back down to below 13.
The major concern here is how once again the rally stopped right at a major resistance line that's been capping rallies since February. As far as we know, this instance may be no different than the last few have been.
It's not just the S&P 500's failure to break out multiple times that's waving a red flag, however. The NASDAQ Composite (COMP) and the Russell 2000 (small cap) (IWM) indices are both in a fair amount of technical trouble the S&P 500 isn't in. It's a big deal, because the NASDAQ and the Russell 2000 generally lead the market higher as well as lower. If they're lagging now, this rally effort may lack the undertow it needs to achieve escape velocity.
For the NASDAQ Composite, its inability to decisively crawl back above the 20-day moving average line (at 5001) is telling. It's also worth noting the NASDAQ's volume on most of the bearish days has been measurably higher than the volume's been on the few bullish days we've seen since the peak on April 27th.
NASDAQ Composite & VXN - Daily Chart
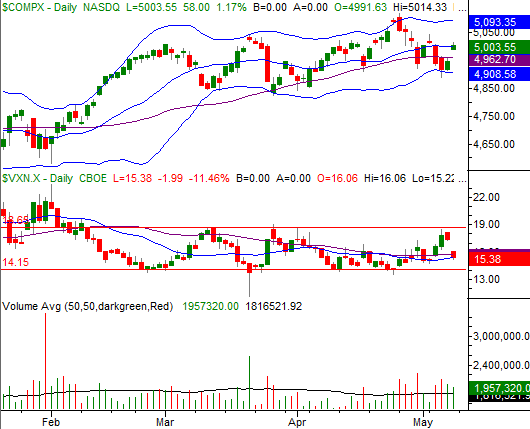
Chart created with TradeStation
The Russell 2000 is even less impressive, in that it's not even in a position to challenge its short-term moving average lines - the 20-day and 50-day moving averages at 1246 and 1250, respectively - as a technical ceiling.
Russell 2000 - Daily Chart
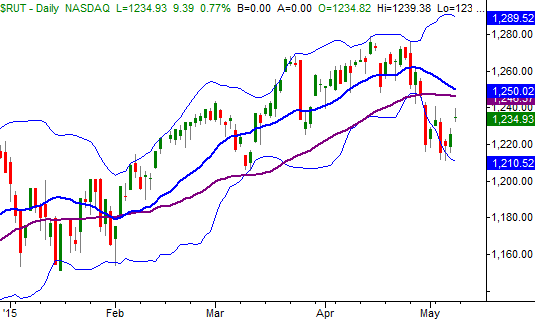
Chart created with TradeStation
This relative weakness from small caps and the tech-heavy NASDAQ is unusual. In fact, it's the first time we've seen it this bad since July, which ultimately preceded (and in some ways started) the steep October selloff.
Still, the index that encompasses 85% of the market's entire market cap is the S&P 500, and it says the momentum remains bullish. This momentum is much more evident on a weekly chart of it, where we can see how persistent the bulls have been with their attack on 2118. It's also on the weekly chart of the S&P 500 we can see the 26-week moving average line has been such a key driver/supporter of this attack, and we're still nowhere near breaking under that floor at 2070.
S&P 500 & VIX - Weekly Chart
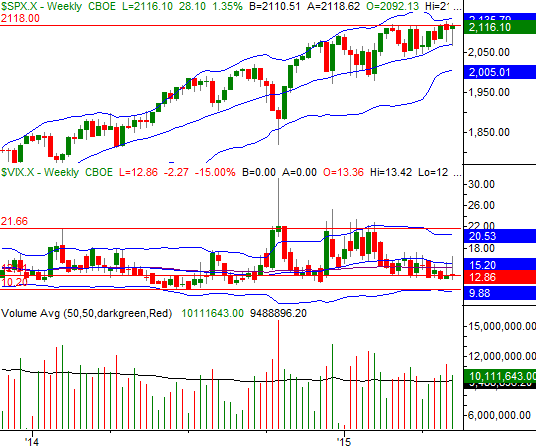
Chart created with TradeStation
Bottom line? The BigTrends TrendScore for the equity market is in bullish territory - bias is to the upside. We'll interpret the TrendScore as well as all the other technical clues discussed above at face value and say the market is still in an uptrend. It must be said, however, it's not an ideal uptrend and there are more than the average number of ways it could still be tripped up. Still, the trend is the trend until it clearly isn't anymore.
Trade Well,
Price Headley
BigTrends.com
1-800-244-8736