This Rally Is Getting A Bit Steep - Weekly Market Outlook
This Rally Is Getting A Bit Steep - Weekly Market Outlook
It may have been a shortened week thanks to the long Independence Day weekend, but the bulls managed to cram at least five days of bullishness into only three and a half days of bullishness. The S&P 500 (SPX) (SPY) gained 24.5 points - about 1.2% - last week, pushing deeper into new-high territory.
From a momentum perspective it's a compelling move. From an odds perspective though, it just seems unlikely there's any room left to tack on more gains... especially with a couple of the indices at or near key psychological levels, like the Dow Jones Industrial Average (INDU) (DIA) hitting the 17,000 mark and the S&P 500 within reach of 2000.
We can somewhat rectify the opposing ideas in a moment. First, let's run-down last week's biggest economic news.
Economic Data
While last week's economic data dance card may have been full, the fact of the matter is, none of it mattered much with the exception of June's employment data, released on Thursday. And, it was good... not great, but good. The Department of Labor reported 288,000 new jobs were created last month, with the unemployment rate sinking from 6.3% to 6.1%.
It wasn't a finagled drop in the unemployment rate either, driven by a big plunge in the total labor force rather than a real increase in the number of people with jobs. The number of folks with jobs grew by 407,000, reaching 146.2 million. The number of unemployed people similarly shrank, by 325,000, to 9.5 million. The total size of the nation's labor force only grew by 81,000, to 155.7 million. Point being, there was no gimmick behind the progress on the employment front - we really did take a decent step forward. The trends for all this data is plotted on the chart below.
Employment Trends Chart
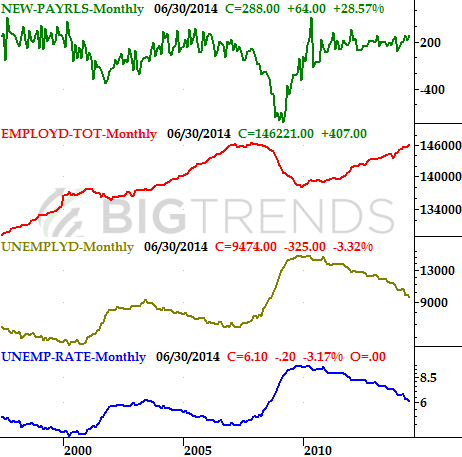
Source: Department of Labor
Everything else for last week and this week is on the calendar below.
Economic Calendar
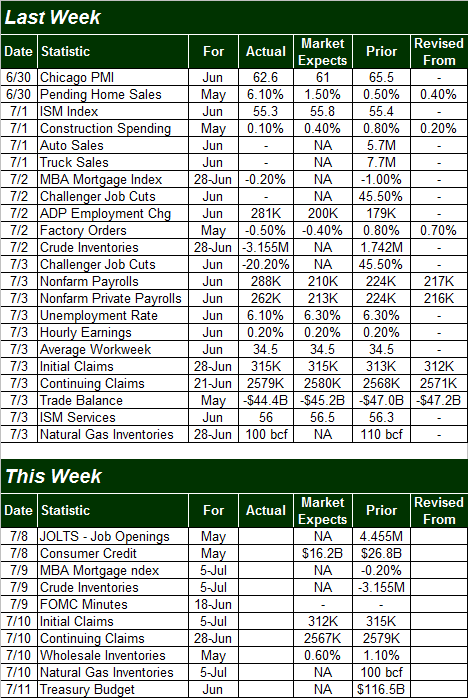
Source: Briefing.com
Not only is this week's economic calendar not full, but none of what little is on it is bound to move the market. The biggest piece of data on the way may be the release of the federal Reserve's June meeting minutes on Wednesday, but it's unlikely we'll get any curveballs there. Besides, Q2's earnings season will have started by then, so most eyes will be thinking about that news rather than any relatively meaningless economic data.
Stock Market Index Analysis
As was noted above, you have to respect - even like - the market's current momentum. Yet, one also has to fear the fact that after the S&P 500's 9.3% rally since the middle of April, stocks are overbought.
There's plenty of context for worry too. This twelve-week, 9.3% runup is an unusually large and unusually long advance. The last time we saw anything close to this was the 8.0% gain between early October 2013 and mid-January 2014 ... a fifteen-week move that saw a decent correction (of about 3.8%) follow it. Before that, the S&P 500 saw a 22.5% advance between mid-November of 2012 and mid-May of 2013. That 27-week move was a 306 point gain for the S&P 500, however, could be deemed an outlier. Prior to that but after the 2009 bottom, most rallies were winding down by the time they got to where the current rally is now. Point being, we're - for the most part - in scary territory. The weekly chart of the S&P 500 puts it all in perspective.
S&P 500 & VIX - Weekly Chart
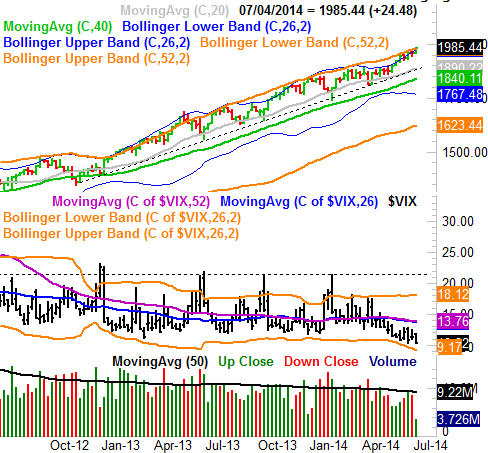
All charts created with TradeStation.
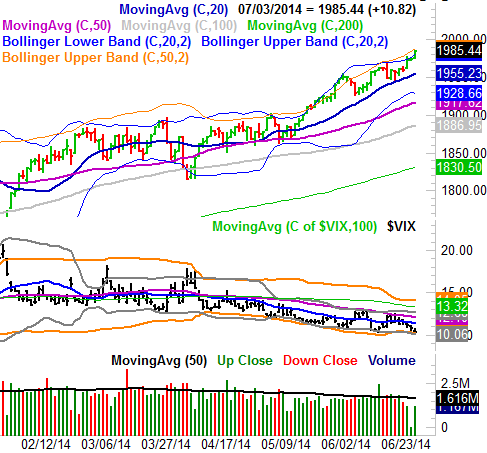
Zooming into the daily chart of the S&P 500 doesn't exactly tell us anything new, but it's in this timeframe we can get a feel for just how overbought stocks are at this point. The index is now 8.4% above the 200-day moving average line (green), and the CBOE Volatility Index (VIX) (VXX) closed at a multi-year low of 10.30 on Thursday. Both are more than a little unusual, and even if some of the oddity behind it can be chalked up to the holiday weekend, this is still a hurdle the market's going to have to contend with when normal trading has resumed this week.
S&P 500 & VIX - Daily Chart
Not much really changes when we switch views to the NASDAQ Composite (COMP) (QQQ). But, we do add some clarity to the situation. Specifically, we can see on the daily chart of the NASDAQ what tends to happen when the tech-heavy index gets this far removed from the 200-day moving average line (green). We saw it in late January and again in early March, and both times resulted in big pullbacks ... the second of which was particularly nasty. Though we're not quite as beyond the 200-day line now as we were then, we're close, and just as ripe for a resolution of the overbought condition.
NASDAQ Composite & VXN - Daily Chart
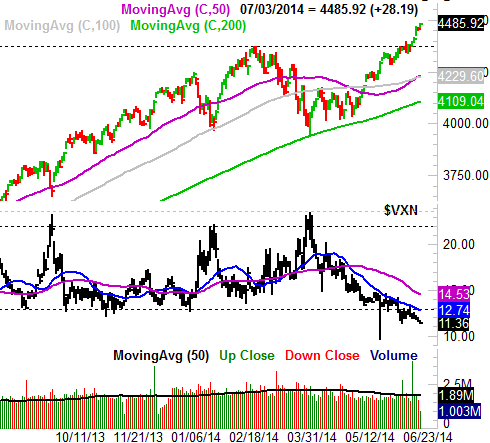
We can also see how dangerously low the Nasdaq Volatility Index (VXN) has gotten over the course of the current rally. It's at multi-year lows now, and aching to move higher.
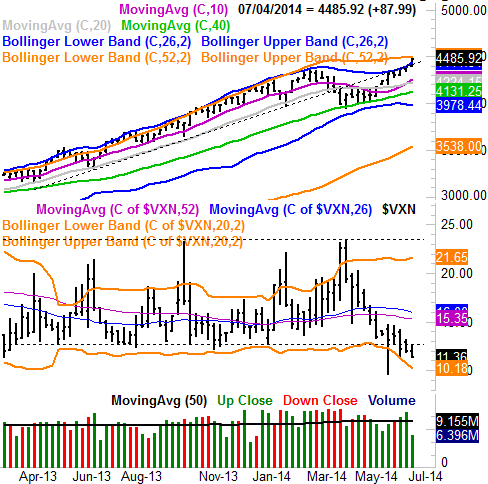
The weekly chart of the NASDAQ Composite doesn't reveal any new clues, but it does offer some more perspective. Namely, we can see how amazingly low the VXN is here. We can also see how the composite itself has bumped into the upper 52-week Bollinger band. As you can see on the chart's long-term history, although this encounter with the upper Bollinger band doesn't inherently mean a pullback is in the cards, the upper band line does tend to contain any further rally effort.
NASDAQ & VXN - Weekly Chart
Conclusions? The assessment of the current situation is simple enough - the momentum is compelling, but stocks are overbought. The question is, which outcome are you willing to trust at this point? More bullishness built on momentum, or the overdue correction? The charts say stocks are a 50/50 proposition at this point, but being realistic, there's unlikely to be much - if any - upside left, with a ton of downside risk just waiting to pull the rug out from underneath the market. The onset of earnings season may well be the catalyst to get the bearish ball rolling. Even if it's not earnings that starts the tumble, however, there's still lots of other ways for bad news to exploit the market's vulnerability here.
Trade Well,
Price Headley
BigTrends.com
1-800-244-8736