Still In No Man's Land - Weekly Market Outlook
Still In No Man's Land - Weekly Market Outlook
Despite the strong bullish effort on Friday, stock's booked a loss for the past week. On the other hand, the market finished the week on a bullish foot, which broadly suggests we'll hit the ground running in an upward direction this week. (It doesn't hurt the bullish case that the longer-term trend is still technically intact.)
We'll weigh the odds below, after looking at last week's big economic news and previewing some of this week's economic data.
Economic Data
While we got a large number of economic data nuggets last week, truth be told, not many of them were very hard-hitting. There was one enormous one though - the Federal Reserve's decision NOT to raise rates. Although maintaining the fed funds rate came as no real surprise, the language the FOMC used to explain its stance broadly suggested the Fed was still open to a rate hike in the near future.. maybe even as soon as June.
The second-biggest piece of news was good was the first estimate of Q1's GDP growth. It wasn't great. Economists are presently reporting only 0.2% (annualized) growth for the quarter. It's a stark downturn relative to Q4's 2.2% improvement. Port strikes, weather, and a strong U.S. dollar all contributed to the weakness.
GDP Growth Chart
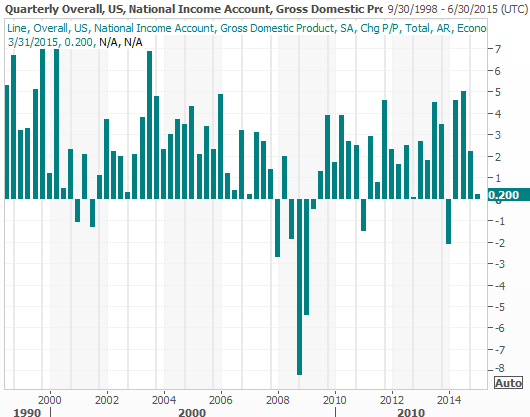
Source: Thomson Reuters Eikon
It was also a big week for consumer sentiment measures. The Conference Board's consumer confidence score fell from 101.4 to 95.2, and the Michigan Sentiment Index grew from a score of 93.0 to 95.9. Either way, both remain in solid long-term uptrends.
Sentiment Trends Chart
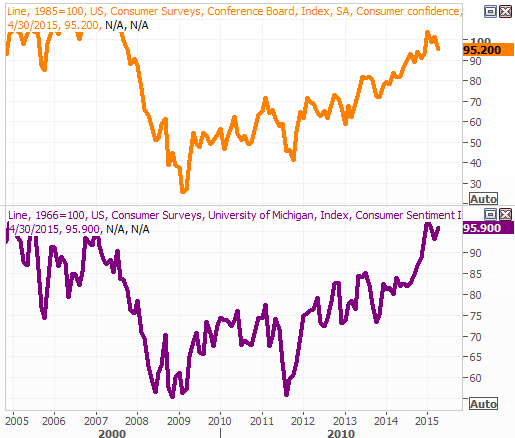
Source: Thomson Reuters Eikon
Finally, the PMI Index edged back above the key 50 level for April, rising from 46.3 to 52.3. The ISM Index didn't move upward, holding steady at 51.5. But, as long as it's above 50, it's on the right side of the scale. Either way, these scores/trends haven't exactly been impressive of late.
PMI and ISM Indices Chart
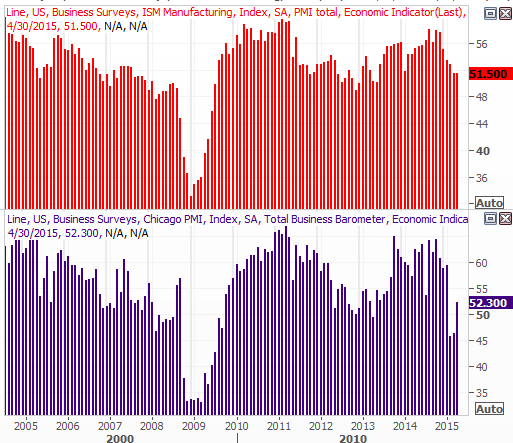
Source: Thomson Reuters Eikon
Everything else is on the following grid:
Economic Calendar
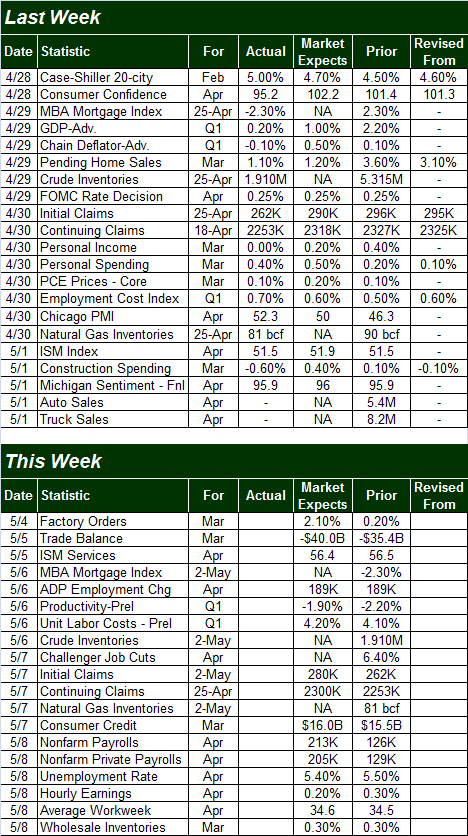
Source: Briefing.com
The coming week is going to pretty busy as well, though the highlight will be the unemployment update to be revealed on Friday. Though the unemployment rate has continued to slide low, actual job growth has tapered off (though it is still positive). Economists are calling for April's unemployment rate to hold steady at 5.5%, on the heels of 255,000 new jobs. That would be a big improvement on March 126,000 new jobs.
Employment Trends Chart
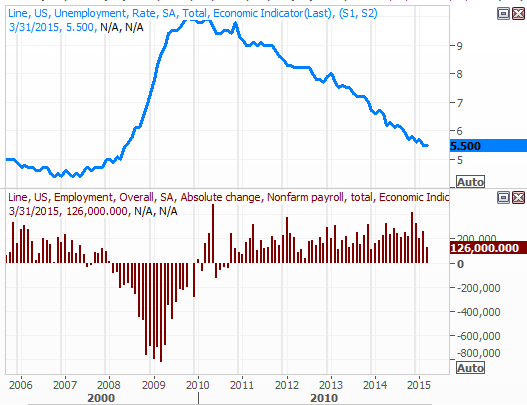
Source: Thomson Reuters Eikon
Stock Market Index Analysis
Despite Friday's sharp bounce, the S&P 500 (SPX) (SPY) still closed in the red last week, to the tune of 0.44%. As was noted already though, the market finished the week on a bullish foot, pushing off of the pivotal 50-day moving average line after falling back into it the day before. As you can also see on the chart below, the CBOE Volatility Index (VIX) (VXX) rekindled its downtrend after bumping into its upper Bollinger band on Thursday and being repelled by it.
S&P 500 & VIX - Daily Chart
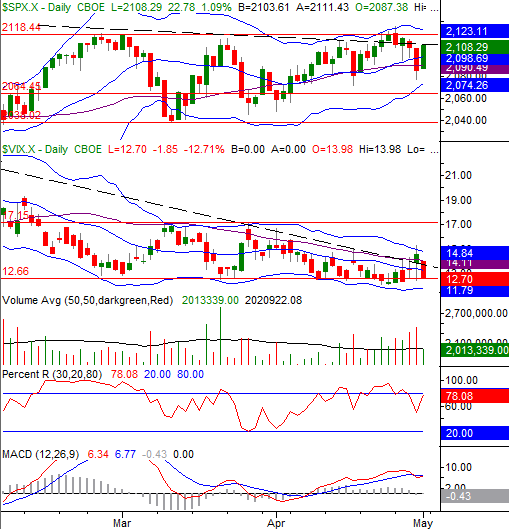
Chart created with TradeStation
As it stands right now, the trend is bullish, though not perfectly so.
The core of the bullishness simply stems from long-term momentum that isn't impacted by the short-term ebbs and flows like we saw over the course of the first four days of last week. Bolstering that bullishness is Friday's upswing. It's far from rock-solid bullishness though. Neither the MACD lines nor the Percent R indicator are convincingly into bullish territory, and perhaps most of all, the S&P 500 isn't yet above the most important technical ceiling at 2118.
The weekly chart of the S&P 500 doesn't tell us anything new. It does, however, offer us some more perspective on what we already know. Namely, the ceiling at 2118 is even more meaningful from this perspective, and we can see how well the index has been supported at its 26-week moving average line since testing it back in January. `
S&P 500 & VIX - Weekly Chart
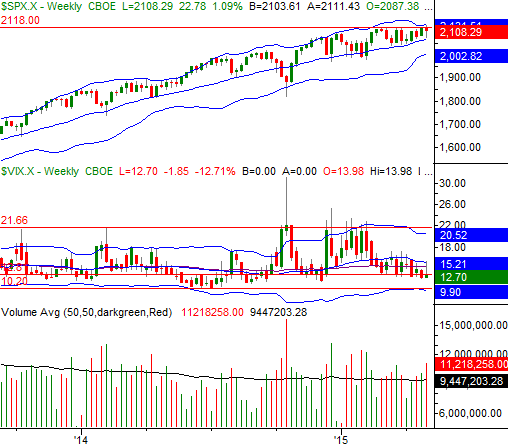
Chart created with TradeStation
In many ways the support at the 26-week line (currently at 2067) and the horizontal ceiling at 2118 is bringing the whole issue to a point where either things get decidedly bullish or decidedly bearish - there's little room left to maneuver inside those converging lines.
It's also in this timeframe we can see that while the VIX feels unusually low right now and is dealing with a floor at 12.3, that's not the absolute lowest the VIX can go. The 10.2 mark was where the VIX finally found a floor in the middle of last year.
In other words, there is some room for decent upside from the market in the near-term.... though it all has to start with a break above 2118 from the S&P 500.
The NASDAQ Composite (COMP) is in the same proverbial boat. That is, the NASDAQ really needs to clear the resistance level at 5044 before we can get too bullish, but its undertow - as it stands day - is pointed in that direction. Likewise, the Nasdaq Volatility Index (VXN) would need to break under 14.1 rather than just find support at it if the NASDAQ is to really be able to make a decent gain.
NASDAQ Composite & VXN - Daily Chart
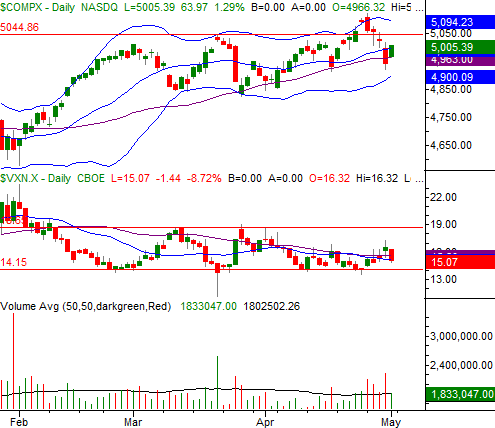
Chart created with TradeStation
It's the weekly chart of the NASDAQ that may clarify the NASDAQ's (and the market's for that matter) biggest hurdle. A rising resistance line that extends all the way back to mid-2014 was the ultimate prompt for the peak two weeks ago and last week's pullback. It's still something that could cap any rally effort again.
NASDAQ Composite & VXN - Weekly Chart
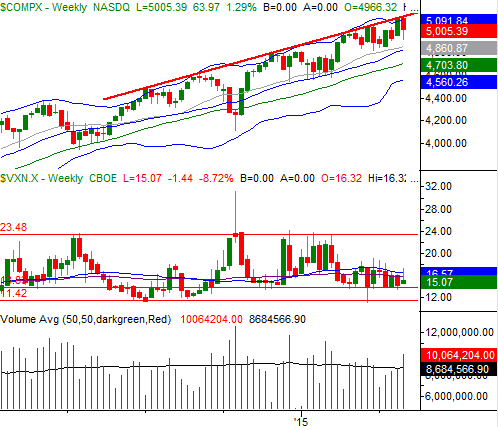
Chart created with TradeStation
Bottom line? The trend is still bullish, though bear in mind it's a wishy-washy trend that could easily fade before the key technical hurdles are cleared. On the flipside, we still can't presume the worst for stocks until the S&P 500 breaks under 2070.
In other words, we're mostly just on the bullish edge of no-man's land and a conclusion to the recent choppy range should be coming fairly soon with a stronger trend move.
Trade Well,
Price Headley
BigTrends.com
1-800-244-8736