Can The Nasdaq Comp & Russell 2k Give The Next Boost? - Weekly Market Outlook
Can The Nasdaq Comp & Russell 2k Give The Next Boost? - Weekly Market Outlook
Though the market may have gotten off to a bad start with Monday's 0.7% stumble, the bulls took charge again the very next day to hammer out a gain for the week. Granted, it was less than a 0.4% gain when all was said and done, but a gain is a gain.
On the other hand, it didn't take long after last week's turnaround from Monday's dip for the lethargy to set in again (some of which is likely due to the winter holiday season). Once again, the S&P 500 (SPX) (SPY) is bumping around new-high territory, but failing to clearly move above this area.
We'll dissect the action and weight the odds, but let's first set the bigger-picture stage with a look at last week's major economic news.
Economic Data
There was plenty of economic data in the lineup last week, but all eyes were on Friday's unemployment data. The jobs numbers were better than expected, but when you delve in they are perhaps not as good as the headlines implied.
Yes, Bureau of Labor Statistics reported that in November the U.S. economy added (net) 321,000 jobs, more than jiving with the ADP payroll report of 208,000 new jobs being created in November. So why didn't the unemployment rate change from 5.8%? It's got to do with the way the unemployment is calculated. The number of people who count themselves as unemployed - but willing and able to work - grew just about as much as the entire labor pool (employed or not) did, resulting in no net change of the proportion of unemployed-to-total-labor-force. It's a dubious improvement... more people are working, but more people that would like to have a job are also not working.
Employment Trends Chart
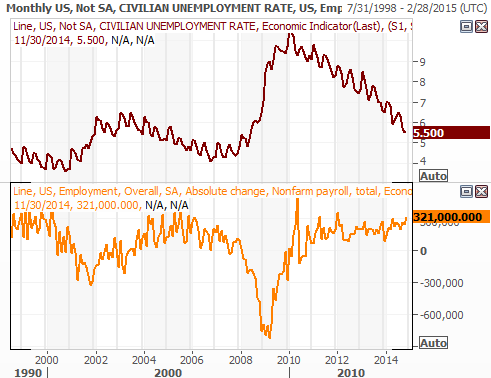
Source: Thomson Reuters Eikon
The proverbial litmus test continues to be the labor force participation rate and the employment rate of the nation's population. The percent of the nation's inhabitants at work now is 59.2%, up from a low of 58.3% on late-2009, but still well under the peak at 63.3% seen in 2007. The percent of the population that's officially in the labor force (working or not) is still at 62.8%, just as tad above the multi-year record low of 62.7% hit in September. Some, though not all, of that decline can be blamed on the ongoing wave of retirement of the baby-boomers.
Employment Ratios Chart
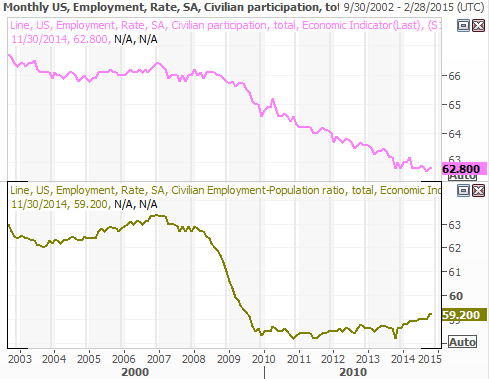
Source: Thomson Reuters Eikon
On other fronts, the Institute for Supply Management's data was a mixed bag. The overall index slumped from 59.0 to 58.7, but the ISM Services Index advanced from 57.1 to 59.3 in November.
ISM Indices Chart
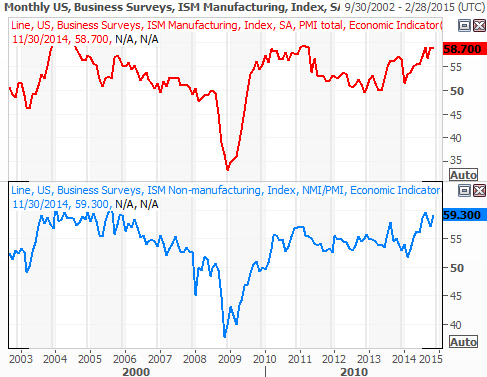
Source: Thomson Reuters Eikon
The Department of Labor reported a revision to Q3's productivity rate. The DOL now says it was up 2.3% in the third quarter, and not the previously suggested 2.0% increase. Also, factory orders fell 0.7% in October following September's dip of 0.5%. Neither is considered hard-hitting data, however.
Economic Calendar
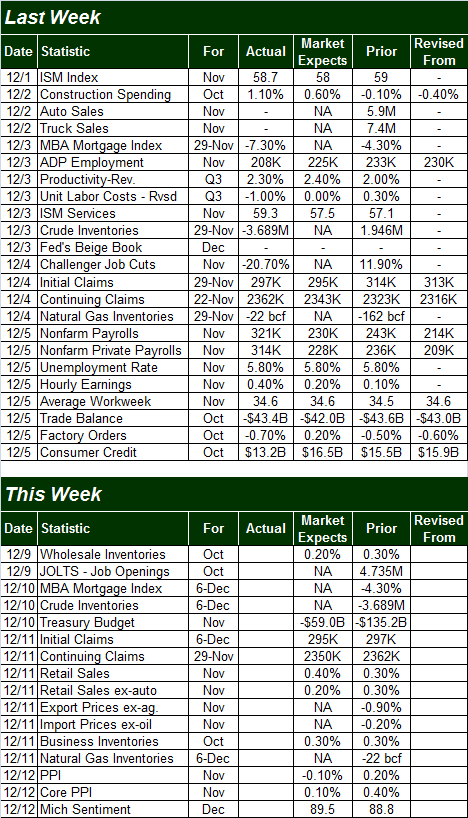
Source: Briefing.com
Stock Market Index Analysis
Truth be told, while the chart of the S&P 500 looks a little concerning, charts of the Russell 2000 (RUT) (IWM) and the NASDAQ Composite (COMP) (QQQ) appear to have found new zeal. That 's an important difference to point out, as the more aggressive/speculative names found in those indices tend to lead the market higher, and lower.
Be that as it may, a look at all the relevant charts is in order, beginning with the S&P 500. The red flag becomes clear almost immediately - the large cap index is still struggling to get clearly past the 2075 mark that ended up being something of a problem two weeks ago too.
S&P 500 & VIX - Daily Chart

Chart created with TradeStation
In the grand scheme of things it's not a deal-breaker. The BigTrends TrendScore reading was last seen at 97.4 (out of 100), and the PercentR reading (using the BigTrends smoothed out method on this indicator) is still well above the 80 level. Point being, the uptrend remains intact, though a close above the 2075 mark could allow the bulls and longs to relax a bit.
The only true potential worry we might have with this chart is some complacency seen in the CBOE Volatility Index (VIX) (VXX), which closed at 11.82 on Friday. The VIX below 12.5/12 is very low and shows option traders aren't very concerned right now and expect low volatility during this holiday season. Even then, however, we've seen lower VIX readings in recent months, and we've also seen the VIX linger around the 12 area for weeks on end.
A need for worry would arise if the VIX were to move above a near-term ceiling at 15.30 AND the S&P 500 were to break under the 20-day moving average line at 2057.4. While that possibility is on the table, even if it should happen, any ensuing dip should be modest based on the broad strength we've seen. That premise is bolstered by the shape of the NASDAQ and Russell 2000 charts.
Although the NASDAQ technically closed in the red last week, by 0.2%, the bullish momentum we've seen develop following Monday's 1.3% plunge doesn't seem to be hitting the same headwind the S&P 500 is. That may only be because the composite hasn't pressed on to new-high territory yet. Between the bullish momentum, the falling Nasdaq Volatility Index (VXN), the near-term support line that's developed, and the still-strong PercentR indication, the risk/reward ratio remains heavier on the reward side. Support is currently at 4767, and then the 20-day average line at 4718.
NASDAQ Composite & VXN - Daily Chart
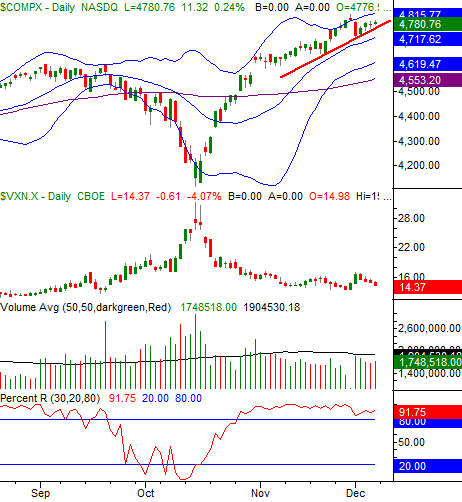
Chart created with TradeStation
As for the Russell 2000, incredibly enough, it's still not recovered from its March-May tumble that had many traders convinced we were entering a new bear market. It brushed its prior peak in July 1st, but pulled back again to an even lower low of 1040.27 on October 15th. On the surface it's a worry - small caps should lead the way in a bull market, but they haven't been leaders in a while. The rebound from Monday's drip right at the lower 20-day Bollinger band, however, suggests the bulls are consolidating between 1155 and 1192 in order to make a run on the ceiling at 1212. If the Russell 2000 can actually clear 1212 anytime in the foreseeable future, that would really breathe new life into the overall rally. Conversely, a move under the floor at 1155 could deflate the market's optimism in a hurry.
Russell 2000 - Daily Chart
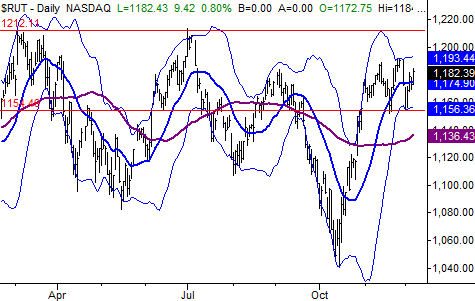
Chart created with TradeStation
We have to assume the trend is our friend and will remain intact until there are clear reason not to. The signals will be clear breaks under the support levels noted above for all the key broad market indices.
Trade Well,
Price Headley
BigTrends.com
1-800-244-8736