Calendar Axiom Broken, But Valuations Are A Concern - Weekly Market Outlook
Calendar Axiom Broken, But Valuations Are A Concern - Weekly Market Outlook
So much for the "Sell in May" axiom. The market just logged its second bullish week in a row at a time of year that's not supposed to be bullish at all. For May, the S&P 500 (SPX) (SPY) gained an impressive and surprising 1.8%.
Is this a sign that stocks are just so hot and so underestimated that there's just no stopping them? Or, were the past couple of weeks just a little lucky volatility we'll end up paying the price for in June in the form of a pullback?
We'll weigh the odds in a moment, right after a run-down of last week's and this week's most important economic numbers.
Economic Calendar
It wasn't a terribly busy week in terms of the amount of data we get, but a couple of the items we got were more than a little important.
We kicked things off on Tuesday with the last of the real estate data we'd be getting in May... the Case-Shiller Index (of home prices) and the FHFA Housing Price Index. Both showed strength, jiving with the other housing and construction data we had heard over the course of the two weeks before the home pricing data was revealed. The Case-Shiller Index said home prices in March were up 12.4%, while the FHFA reported a comparable 0.7% uptick in March's prices compared to February's levels. Bear in mind these two data sets are a month behind the rest of the housing data, though the delay doesn't negate the fact that we're seeing a rebound here from the late-2013 lull.
Real Estate Trends Chart
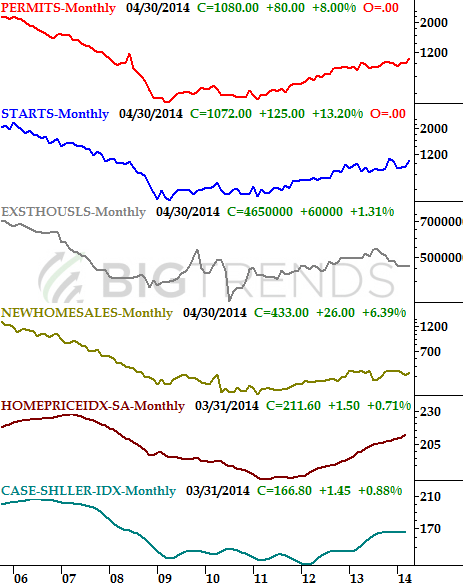
Source: Standard & Poor's, FHFA, Census Bureau, and National Association of Realtors
We also got an updated estimate on Q1's GDP growth... .not exactly an award-winner. The initial estimate given last month was for a mere 0.1% uptick, but with more data in hand, now it looks like the economy actually shrunk 1.0% in the first quarter. The third and final estimate will be posted in a couple of weeks, but it's unlikely we'll see any major changes.
Finally, it was a big week for consumer sentiment. In Tuesday we learned the Conference Board's measure of consumer confidence ticked a bit higher in May, from 81.7 to 83.0. But, on Friday we also learned the final reading for May's Michigan Sentiment Index rolled in at 81.9, down a little from April's official score of 84.1.
Consumer Confidence and Michigan Sentiment Survey Chart
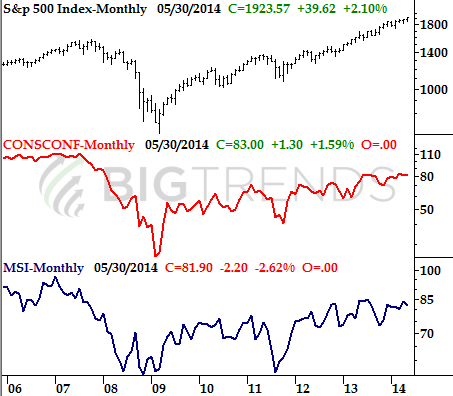
Source: Reuters and Conference Board
Economic Calendar
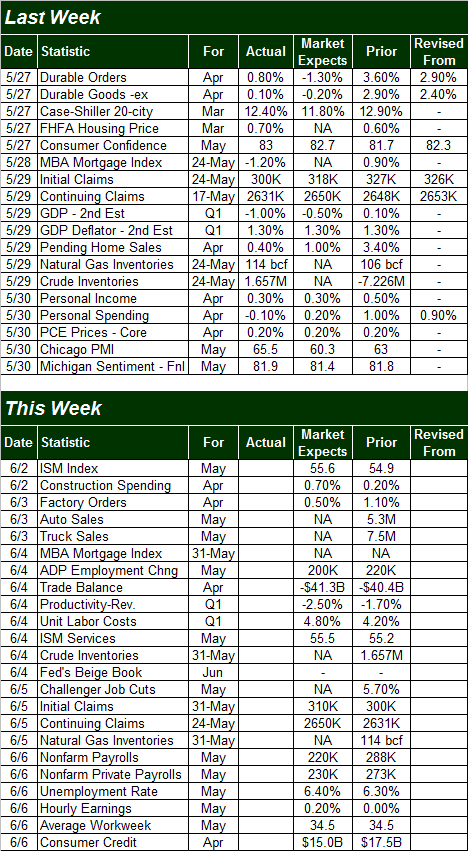
Source: Briefing.com.
This week looks like it should be much busier, but truth be told, there's only one high-impact batch of news in the lineup... Friday's employment data. The pros say we're going to add 235,000 new jobs for May, down from April's 288,000 new jobs. Due to the way the figure is calculated, however, these same pros expect the unemployment rate to increase from last month's 6.3% to 6.5% this time around.
Stock Market Index Analysis
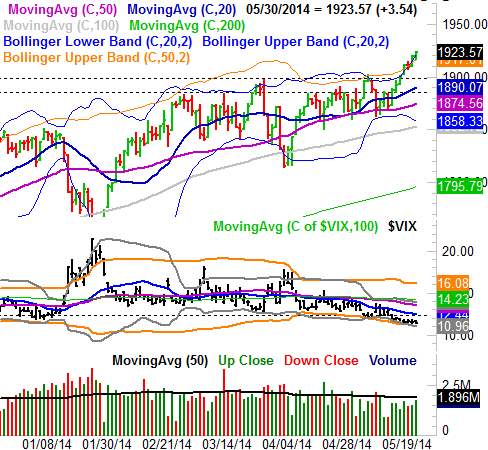
There aren't a lot of ways to interpret the move into record-high territory for the S&P 500. After two months of trying, the SPX finally cleared the hurdle at 1900 last week to close at 1923.57. While there are still a few ways the bears could trip the market up, it is what it is; the market has proven it's not unable to forge ahead. The weekly chart of the S&P 500 tells the tale - it took two months to do it, but the rally's back on the move.
S&P 500 & VIX - Weekly Chart
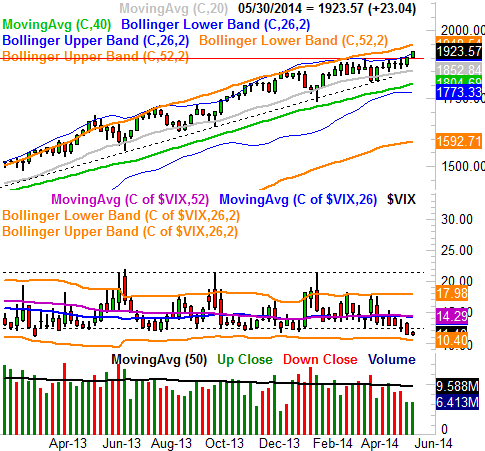
All charts created TradeStation
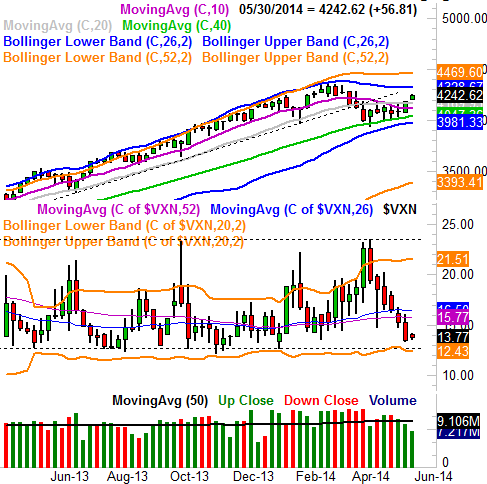
Equally encouraging (perhaps more encouraging now) is the way the NASDAQ Composite (COMP) (QQQ) has also sprung back to life in the weekly timeframe. The downtrend is was in during late March and early April has not only been quelled, but reversed. As of last week, the composite just logged a second week of higher highs and higher lows, and is back above the 100-day moving average line (gray) after finally pushing off of the 200-day moving average line (green) for several weeks. And better still, the NASDAQ has room to keep rising before bumping into technical ceiling around 4324 and 4470.
NASDAQ Composite & VXN - Weekly Chart
Nothing really changes when we zoom into the daily charts, though we do gain some clarity on the whole situation when we examine things in this shorter timeframe. And this time, it's the duo of the DJIA (INDU) (DIA) and the S&P 500 that offers the most insight.
We already know the S&P 500 hit record highs last week, pushing past the ceiling at 1900 two weeks ago and continuing that move last week. It's a solid and legitimate breakout, though an unlikely (and unlikely sustainable) move this time of year.
Note on the SPX Daily chart below that the CBOE Volatility Index (VIX) (VXX) continues to stay low and has remained below its previous floor in the 12/12.5 area.
SPX & VIX - Daily Chart
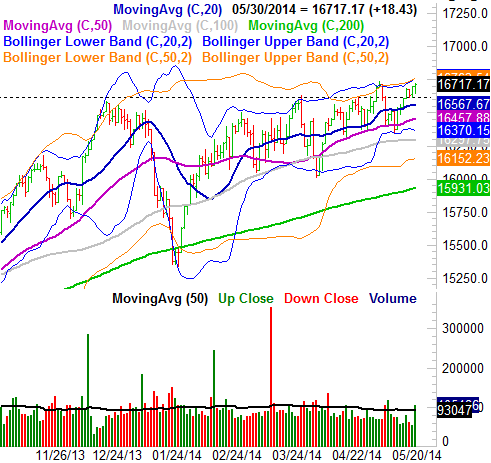
And the Dow Jones Industrial Average? It actually did NOT hit new multi-year highs last week... though it came very close to doing so. It DID, however, cross back above a key ceiling at 16,615, and seems to have some bigger-picture momentum.
Dow Jones Industrial Average Daily Chart
So what's the call? This is where it gets tricky, perhaps to the point of being messy.
From a bigger-picture perspective, we have to respect - and interpret at face value - the fact that the Dow and the S&P 500 have both pushed past technical resistance. On the flipside, we also have to acknowledge that the market generally doesn't make major moves in the spring or summer, and has been particularly reversal-prone of late. That means we're probably due for a pullback to some degree soon... as in maybe this week.
The question is, how big might that pullback be? As long as the Dow doesn't break below 16,570 or so and the S&P 500 doesn't pull under 1890, the broad uptrend can stay alive and the dip will just be a buying opportunity; just wait to see the bulls start filing back in again. With all of that being said...
It's not a technical matter, but it's a reality all technical traders are going to have to face now - stocks have become uncomfortably expensive thanks to this week's tip-toeing into record-high territory. As of right now, the S&P 500 is valued at a trailing P/E of 17.64. We've seen, and even survived, higher P/E ratios, but it's rarely been easy. The forward-looking P/E of 15.4 makes things a little more palatable, but a lot can happen in twelve months, and a forward-looking P/E of 15.4 is also at the upper limit of how muck risk the market is willing to take on.
The valuation issue hasn't become a near-term problem yet, and if it becomes a problem, it WILL show up in the charts. Let's cross that bridge when we come to it though. Right now, all we can see with any real confidence is last week's rally has left stocks a little vulnerable to a minor pullback.
Trade Well,
Price Headley
BigTrends.com
1-800-244-8736