Bullish Levels Getting Entrenched - Weekly Market Outlook
Bullish Levels Getting Entrenched - Weekly Market Outlook
It wasn't a pretty or a convincing bullish move, but stocks did make forward progress last week, putting some distance between them and a huge hurdle that had otherwise been holding it back since February. Still, no later than it cleared that ceiling another possible one developed.
We'll take a closer look at this new market situation, right after we review last week's and this week's economic numbers.
Economic Data
It may not have been a terribly busy week last week on the economic front, but it was an important one. We got doses of some pretty heavy-duty news, especially on the real estate and construction front. Specifically, we learned that housing starts ticked higher in April, from a pace of 944,000 to 1.135 million, while building permits rose from an annualized rate of 1.038 million to 1.143 million. We also learned later in the week that existing home sales for last month fell from a pace of 5.21 million to only 5.04 million.
Housing Starts, Building Permits, Existing Home Sales Chart
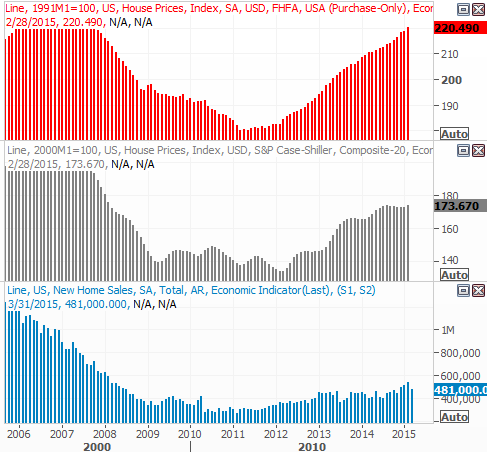
Source: Thomson Reuters Eikon
Still, starts and permits hit multi-year highs, and the overall existing home sales trend is pointed broadly higher. A lack of inventory is a large part of the reason sales of existing homes isn't even stronger.
We also heard last month's industrial productivity information as well as the nation's level of capacity utilization (of our manufacturing-output potential). Both fell for a fifth straight month. A lack of oil and gas drilling is the key culprit, but it's still an adverse impact on the overall economy.
Capacity Utilization/Industrial Production Chart
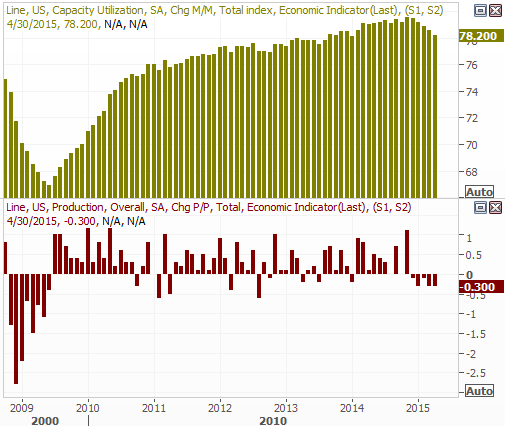
Source: Thomson Reuters Eikon
Last but not least, we also received April's inflation data. It was tepid - again. For the month it was up 0.1% overall and up 0.3% on a core (ex-food and energy prices), but on an annualized basis the overall inflation rate is still a negative pace... or deflation. It stands at -0.2%. Both producer price inflation as well as consumer inflation now stands at negative levels on an annualizes basis, but it's all due to oil/energy. Outside of those two categories (and mostly just oil), inflation rates are hovering just under a nominal 2%.
Producer & Consumer Inflation Chart
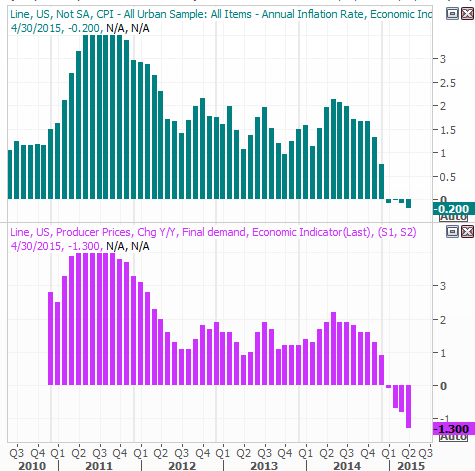
Source: Thomson Reuters Eikon
Last but not least, though there's no data to plot or chart from it, the minutes from April's Federal Reserve meeting were posted on Wednesday. Rates didn't change, but there was some color offered regarding when that might happen - it's very unlikely to happen in June. But, it's still apt to happen by December, with a small possibility of it materializing in September.
Everything else is on the following grid:
Economic Calendar
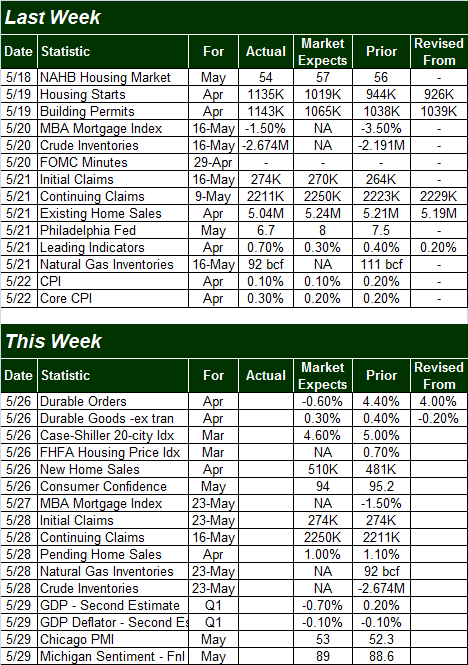
Source: Briefing.com
We're going to round out the look at real estate and construction data this week with an update of the Case-Shiller Index as well as the FHFA Home Price Index on top of the new home sales report, all due on Tuesday. As for home prices, the longer-term trends are reasonably strong, and though it's been a little choppy, new home sales also broadly remain on the rise.
Home Price Indices, New Home Sales Chart

Source: Thomson Reuters Eikon
We'll also hear April's durable goods orders in Tuesday, and we'll get the second Q1 GDP estimate on Friday. Economists don't see any change looming from the initial first quarter GDP change estimate of -0.1%.
Stock Market Index Analysis
When all was said and done, the S&P 500 (SPX) (SPY) gained 3.33 points (+0.1%) last week to close at 2126.06 on Friday. All of that gain - and more - came on Monday though. The rest of the week was rather lethargic, with a new technical ceiling taking right around 2132... near where the index peaked all five days last week.
Don't read that the wrong way. The momentum is still technically bullish, even if it's strained and barely productive. We still have a partial Percent R buy signal; that buy clue will essentially be confirmed by the next close above 2133. We've also still got a bullish MACD signal in place. Or, on an even-more-low-brow basis, the fact that the S&P 500 is now holding above the former resistance line at 2118 is a clue that the bulls are entrenching a little here.
S&P 500 & VIX Daily Chart
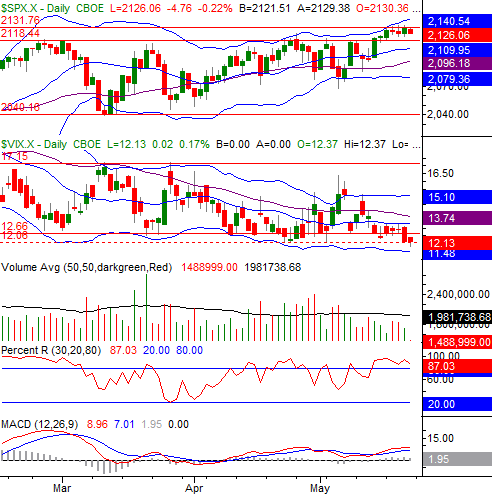
Chart created with TradeStation
In some ways the chart of the NASDAQ Composite (COMP) is even more impressive than the S&P 500's, and in some ways less. More than anything though, much like the S&P 500, it doesn't look like the NASDAQ has a lot of interest in moving any direction.
The good news is, the former ceiling at 5046 has been good and cleared. The bad news is, the rally has already started to slow down. The average daily gains are getting smaller, and the volume behind the advances (which was already tepid) is shrinking even more.
NASDAQ Composite & VXN - Daily Chart
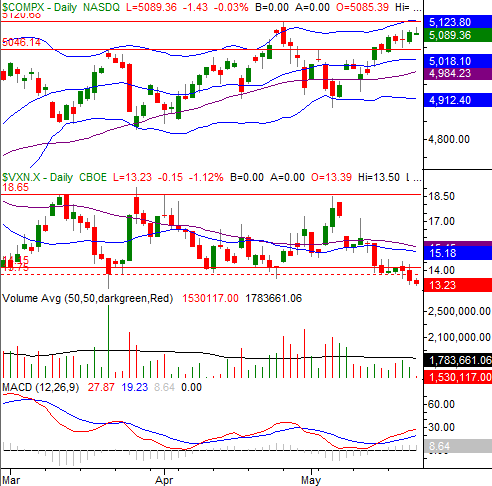
Chart created with TradeStation
The floor at 14.1 for the Nasdaq Volatility Index (VXN) failed to hold up, and the minor floor at 13.8 (dashed) is also broken. That's technically a bullish sign, but it raises the question... how much more room is there for the VXN to keep sinking.
While the scenario looks like a 50/50 proposition in the daily timeframe, zooming out to weekly charts puts the balance of power back on the bullish side of the table. As the weekly NASDAQ chart shows, the composite still has some room to rally before bumping into the upper edge of a long-term ceiling around 5144. Simultaneously, while the VXN looks and feels unusually low under 14.1 right now, in the longer-term timeframe that's not the recent absolute low for the VXN. That's 11.1, hit in mid-2014.
NASDAQ Composite & VXN - Weekly Chart
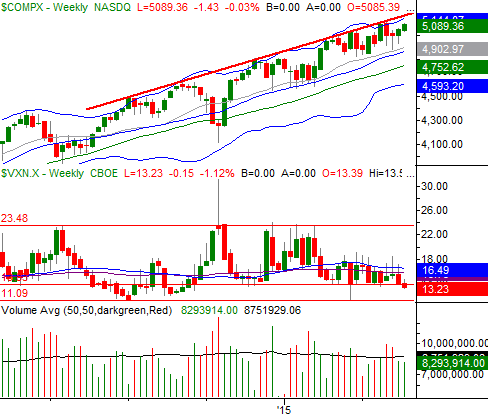
Chart created with TradeStation
In other words, we can't dismiss the possibility that this rally effort is exactly what it looks like it is... another bullish leg (even if a modest one).
Ditto for the weekly chart of the S&P 500. It's anything but impressively bullish, but the uptrend is still intact. There's also room for the CBOE Volatility index (VIX) (VXX) to edge a little lower before the absolute floor around 9.7.
S&P 500 & VIX - Weekly Chart
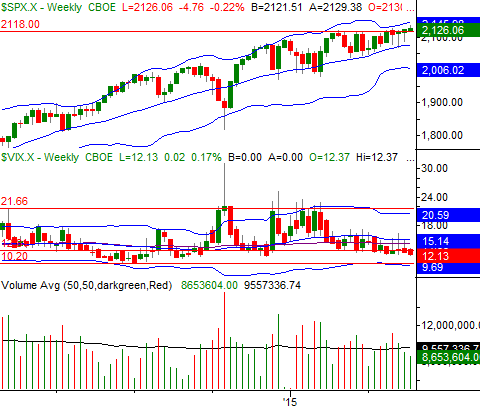
Chart created with TradeStation
Food for thought: This entire rally since October has been a halting one with many stops and starts, and not entirely justified by the fundamentals. But, it continues to grind ahead. The reason? The one thing we've yet to see is a blowoff top, or a climax in selling. Until we get that one amazing last hurrah, stocks may well keep grinding higher. It's going to take a catalyst or a decisive breakdown - the kind that rarely happens when the Fed remains so accommodative and cheery - to jolt this market into a pullback. We've seen no evidence that we're even near one yet. Do remain vigilant looking for those clues, though.
Trade Well,
Price Headley
BigTrends.com
1-800-244-8736