Brutal Fakeout & NASDAQ Breakdown - Weekly Market Outlook
Brutal Fakeout & NASDAQ Breakdown - Weekly Market Outlook
Things were going alone just fine last week, until Friday. That's when investors decided to turn tail. Perhaps it was last month's unemployment numbers that spurred some fear. Or, perhaps it was just the fact that investors felt the market was overbought and didn't want to be left holding the bag should things turn sour over the weekend.
Whatever the reason, it couldn't have come at a worse time (for the bulls). One of the key indices broke under a floor that had been playing a huge support role since mid-2013. Now that it's broken, the game truly has changed.
We'll take a look at what's likely to be next for the market in a moment. Let's take a detailed look at last week's economic framework first.
Economic Calendar
While there was plenty on the economic dance card last week last week, there was only one area that investors really cared about - an update of the employment picture. It was... quite mediocre.
First and foremost, the nation added 197,000 new jobs last month, essentially in line with the 191,000 payrolls that ADP reported early in the week. That's a step forward, though not a big one - the unemployment rate remained stuck at 6.7%. Hourly earnings were flat, and the average number of hours worked per week only swelled from 34.3 to 34.5.
Employment Trends Chart
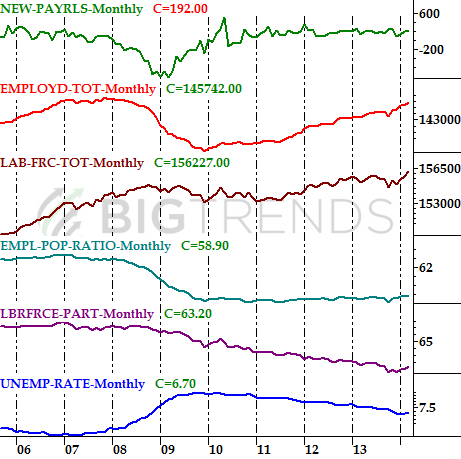
Source: Bureau of Labor Statistics.
In many ways the jobs numbers were perfect for the market. They weren't so strong that the Fed is going to be in a hurry to put the brakes on the modest economic strength. Yet, they weren't so weak that we have to fear an economic implosion. Clearly investors didn't make that same interpretation on Friday, however.
Economic Calendar
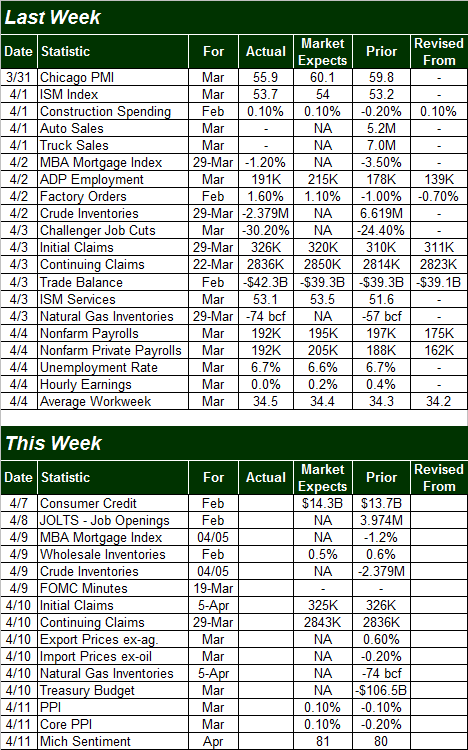
Source: Briefing.com.
As the calendar showed, there's not much on the way this week in terms of economic numbers. And, even within what little we're getting, there's not much that could be market-moving. It should be a relatively tame week, data-wise, which works out ok - earnings season begins this week and all eyes will be on those earliest quarterly reports.
Q1 Earnings Season
Yes, it's here. While we won't get a lot of earnings reports in this first week, we'll get enough to turn the bulk of the focus on earnings. And, by next week, we'll be neck deep in first quarter's earnings numbers. Here are the companies in the lineup for this week, and what the market is expecting.
Earnings Calendar
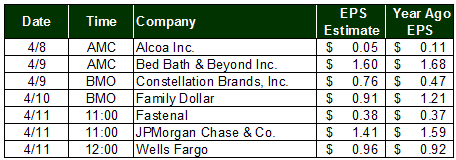
Source: Invest.com
Stock Market Index Analysis
Let's start our analysis this week where we usually do.... with a look at the S&P 500 (SPX) (SPY). As it clearly shows, the index managed to punch through a huge technical ceiling at 1885 by Wednesday. In retrospect, however, one has to wonder if that push to new highs was just a fakeout... a trap, designed to lure any would-be buyers off the fence and into the market just so it could dole out a ton of pain on Friday.
S&P 500 & VIX - Daily Chart
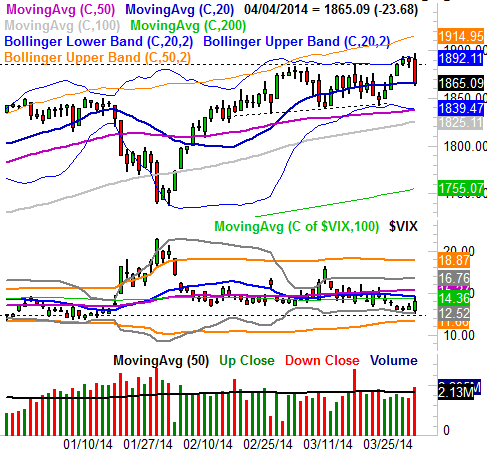
All charts created with TradeStation
So now what? It's interesting that the S&P 500's pullback on Friday stopped right at the 20-day moving average line. That could be important, but truth be told, the 20-day moving average line hasn't been a particularly meaningful floor or ceiling for a while. The more likely support level here is that convergence of support lines right around 1840, which means the S&P 500 still has a little more downside to go before hitting bottom. Makes sense. The CBOE Volatility Index (VIX) (VXX), though it pushed a little higher yesterday, has hardly hit a high level that suggests it has hit a peak and/or the market has hit a key floor.
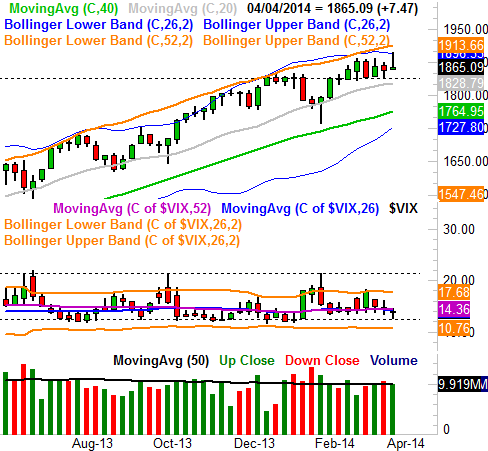
Things don't really change much when you zoom out to a weekly chart of the S&P 500, though from this perspective one might get the feeling that the index has been trying to roll over for a few weeks. It's also on the weekly chart we can see just how low the VIX is in the grand scheme of things.
S&P 500 & VIX - Weekly Chart
So what's this big breakdown that could be a problem for the overall market? It's the NASDAQ Composite's (COMP) (QQQ) chart.
We mentioned last week that the NASDAQ has put some pressure on its 100-day moving average line a week earlier. At that point in time the long-term moving average line had still managed to hold the line and not let the index slide any lower. That changed last week though, with the composite breaking under the 100-day moving average line at 4142 to close at 4127.73. The chart shows just how big of a deal this breakdown is, particularly after the NASDAQ made a string of higher lows since early March.
NASDAQ Composite & VXN - Daily Chart
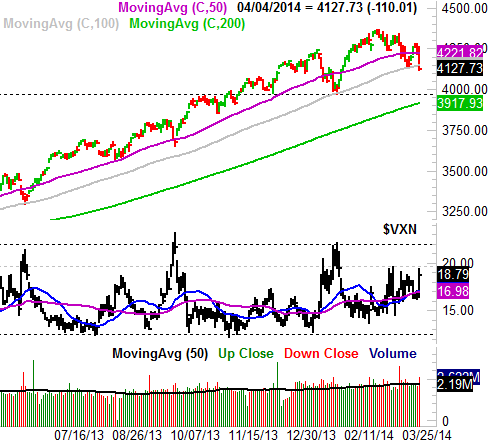
We can also see on the chart of the NASDAQ Composite that its volatility index, the (VXN), has yet to hit its big ceiling at 22.0, which is where it tends to top when the composite hits a major bottom. In other words, the NASDAQ also has room to keep moving lower before finding its ultimate near-term floor.
With all of that being said, know that Friday's huge plunge means anything could happen beginning on Monday. While a modest pullback to end last week could have possibly been the beginning of a larger corrective move, the enormous dip we saw on Friday may be a setup for a dead-cat bounce to kick off this week. There's just no way of knowing what's really in the cards until Monday's opening bell... and even then we may not have the clarity we need until the dust settles early this week. We'll need to watch everything discussed above, however, to get a grip on the market's true direction. The VXN's continued upward thrust (above the 19.70 mark) and the S&P 500's move under its 20-day moving average line will be the big bearish clues, while the S&P 500 will need to get all the way back above 1884 to get all the way back on the bullish bandwagon. The NASDAQ will have to get back above - and stay above - the 100-day moving average line at 4142 too, in order to rejoin the bullish camp.
Almost needless to say, the next couple of days are going to be pivotal.
Trade Well,
Price Headley
BigTrends.com
1-800-244-8736