Weekly Market Outlook - Upside Breakout Amid VIX Lows
Weekly Market Outlook - August 8, 2016
Against the odds, though with the bigger-picture tide, last Tuesday's alarming intraday pullback ended up being just the regrouping the bulls needed to finally stage a breakthrough rally. On the heels of a better-than-expected jobs report for July, the S&P 500 (SPX) (SPY) pushed up and off a key short-term moving average line to finally punch through a resistance line that had been nagging it since mid-July.
Do we take the clue at face value and treat it as a breakout? Or, was Friday's bullishness the proverbial last hurrah for the rally, setting up a pullback that some would say is overdue?
We'll look at the matter from both sides of the table below, right after a quick review of last week's and this week's economic news.
Economic Data
There's little doubt as to last week's major economic headline - Friday's jobs report from the Bureau of Labor Statistics (which dished out a better-than-expected payroll-growth figure) prompting Friday's bullishness.
All told, the United States added 255,000 new jobs last month versus expectations of only an additional 185,000 new positions. That wasn't enough to alter the unemployment rate from June's reading of 4.9%. But, more people are working now than we've ever seen before. The unemployment rate didn't budge mostly because more people officially threw themselves into the labor pool.
Unemployment, Job Growth Trend Chart
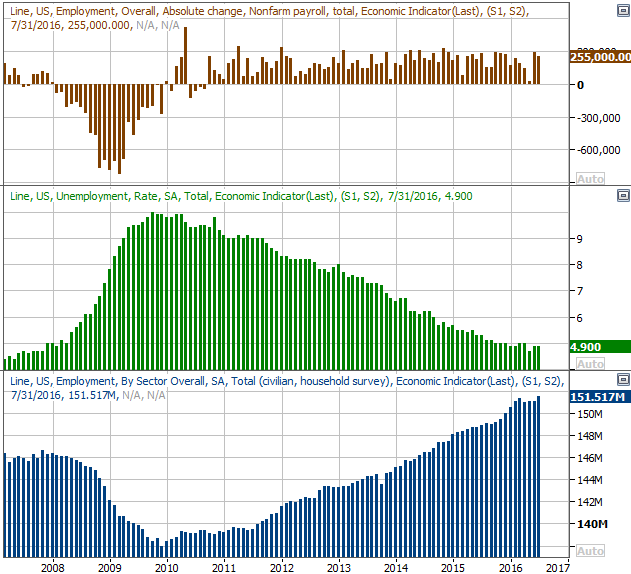
Source: Thomson Reuters
Underscoring the argument that last month's payroll numbers were indeed more positive than negative is the fact that employees worked more hours per week in July than they have in months, and hourly wages went up by a respectable 0.3%. Friday's BLS report confirmed a different report from earlier in the week saying personal incomes were up 0.2% in June.
The employment news wasn't the only big news from last week, however. We also saw both ISM Index updates... the manufacturing index as well as the services index. The former was down from 53.2 to 52.6, while the latter fell from 56.5 to 55.5. Optimists will be quick to point out that both are still above the critical 50.0 level, but it's noteworthy that both are peeling back from higher levels now.
ISM Indices Chart
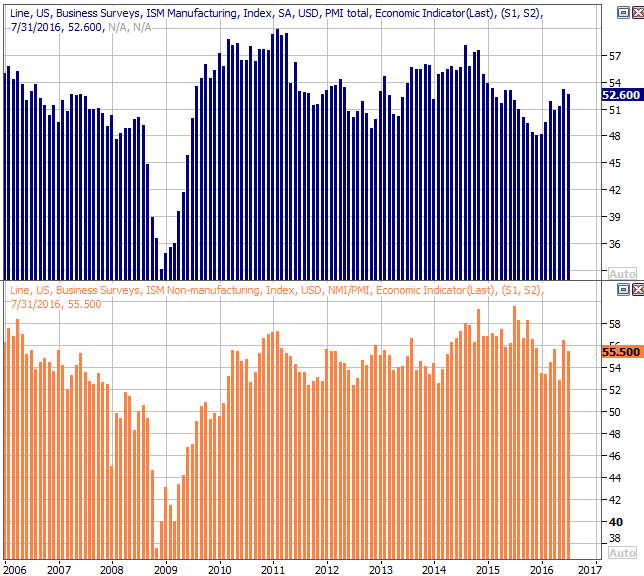
Source: Thomson Reuters
Finally, automobile sales painted a mixed picture last month. Most manufacturers fell short of their projected sales targets, though overall domestic sales of vehicles was up at a point in time when the industry needed to pull itself out of a six-month stretch of deteriorating numbers. Note that sales of cars continue to tumble fast. Truck sales are carrying more than their fair share of weight.
Auto Sales Chart
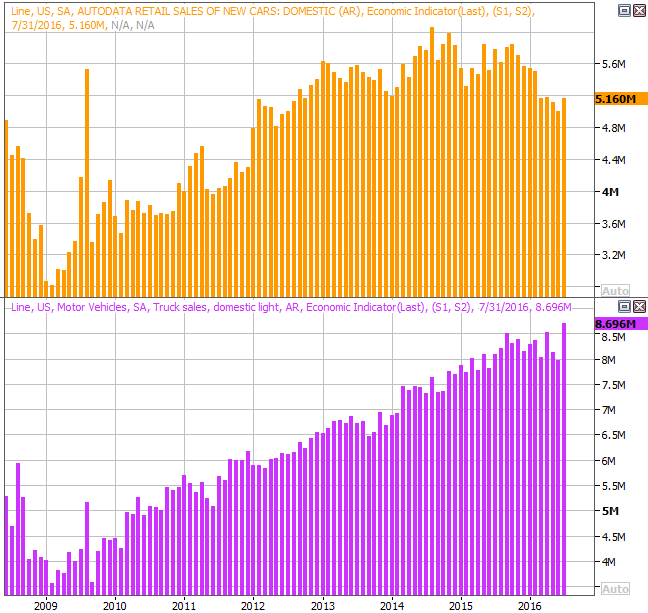
Source: Thomson Reuters
Something that doesn't show up on the unit sales chart - buyer incentives continue to be generous, loosely hinting that automakers are inducing somewhat artificial demand.
Everything else is on the following grid:
Economic Calendar
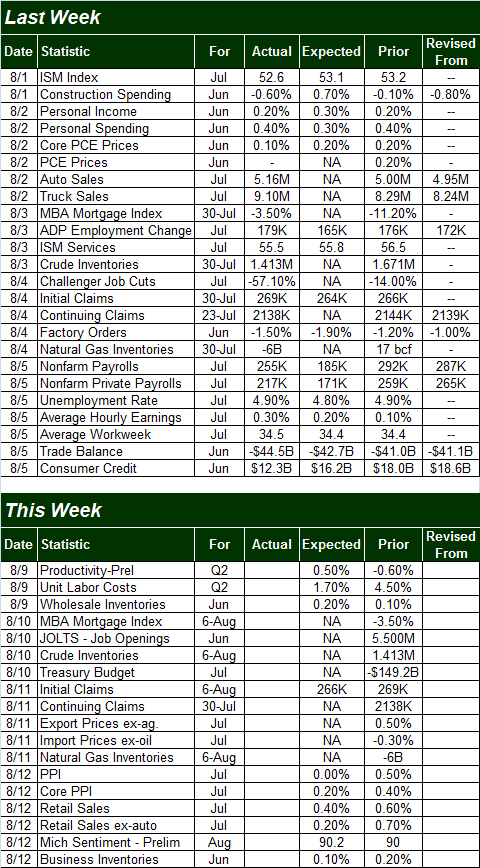
Source: Briefing.com
This week isn't going to be a terribly busy one, and not much of what we're getting is all that important.
The big one is Friday's retail sales report for July. Experts expect a 0.4% increase overall, though that improvement is scaled back to only 0.2% when taking auto sales out of the picture. Those aren't bad numbers, but they're not great either. Considering that two-thirds of the U.S. economy is consumer driven, we need to see better numbers than those -- consistently -- if we're going to pull the broad market out of this earnings funk.
Retail Sales Chart
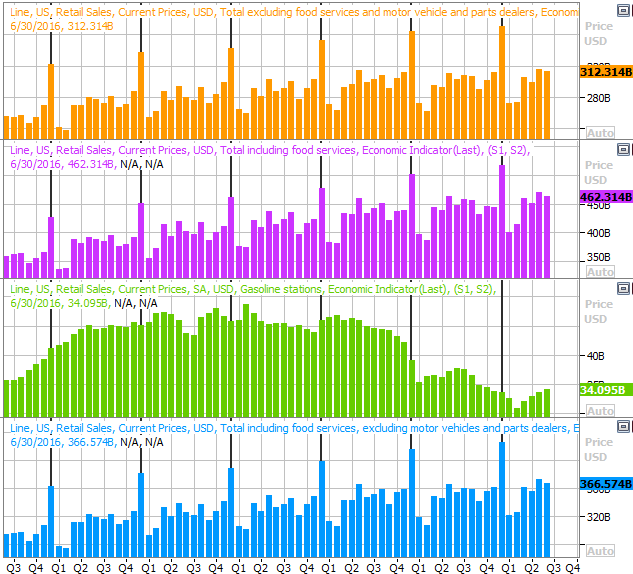
Source: Thomson Reuters
We're also going to get last month's producer price inflation report on Friday. Experts aren't looking for any major increases, which is good in the sense that the Fed may already be feeling more than a little pressured to bump interest rates up after last week's jobs report for July. Then again, if inflation rolls in more than expected, it could really accelerate the Fed's timeline.
Stock Market Index Analysis
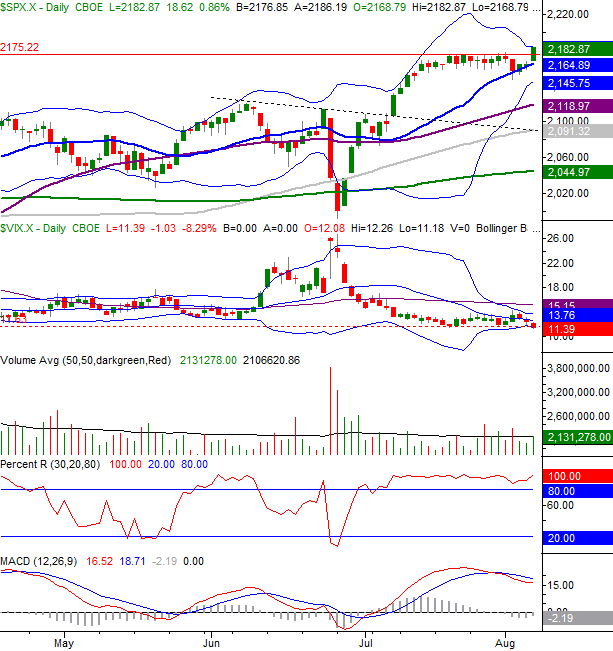
Though the bears gave the bulls a good scare on Tuesday, as it turns out it was just what the doctor ordered. The would-be buyers used Tuesday's intraday pullback as a rallying cry, setting up a big bullish thrust on Friday once the final piece of the puzzle -- strong employment -- was put in place. Friday's surge got the S&P 500 over the hump at 2175.
S&P 500 & VIX Daily Chart
Chart created with TradeStation
It's not an ideal situation for the bulls, mind you. Stocks are (still) overbought and (still) overvalued. But, meltups happen just as often as meltdowns do, and as they say, don't fight the tape. If stocks intend to keep on rallying, that's the trade to play. Notice the Percent R line has technically been in overbought/bullish territory since early July, by virtue of its move above the 80 threshold. That "buy" signal is still intact.
The potential risks here are the S&P 500's encounter with the upper 20-day Bollinger band on Friday, and the fact that the CBOE Volatility Index (VIX) (VXX) is back to extreme lows. Neither are inherently bearish clues though... they just set up the possibility. We'd still want to see evidence of a breakdown before assuming the worst. That would be a move below 2145 for the S&P 500, and a move above 15.0 for the VIX.
The daily chart of the NASDAQ Composite (COMP) doesn't look too different. That is, the NASDAQ bumped into its upper 20-day Bollinger band on Friday, and the VIX dropped to a new multi-month low, right at its lower band.
NASDAQ Composite & VXN Daily Chart
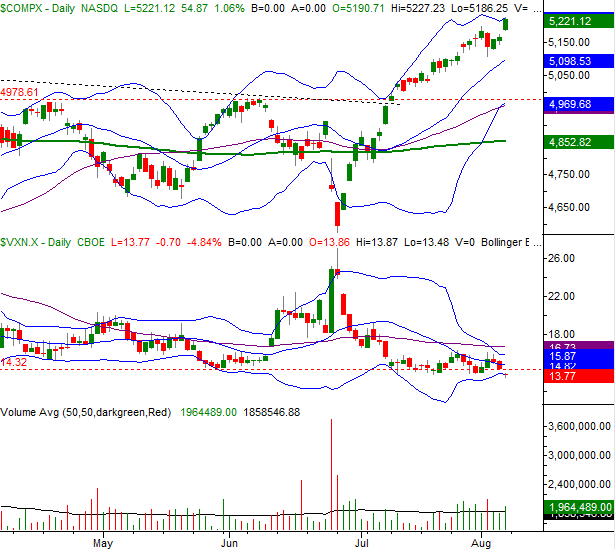
Chart created with TradeStation
Again, in many regards it looks like a setup for an all-too-familiar reversal, but there is a curious difference with the bullishness for the past two weeks.... there's quite a bit of volume behind the move. That suggests the bullish undertow is flowing more firmly than one might guess based on other rally efforts over the past few months.
Zooming out to a weekly chart of the S&P 500 we can gain a little more perspective on the recent leg of the bull market. It is slowing down. But, it may not matter. Now that the technical ceiling at 2134 has been cleared, a base above 2134 may be forming right now. That is to say, while the rally may pause here, there's no guarantee it will result in a pullback. It's entirely possible the S&P 500 could just drift sideways for a while and not only let all the key moving average lines catch up -- and let traders catch up -- but also let earnings catch up to the market's current valuation.
S&P 500 & VIX Weekly Chart
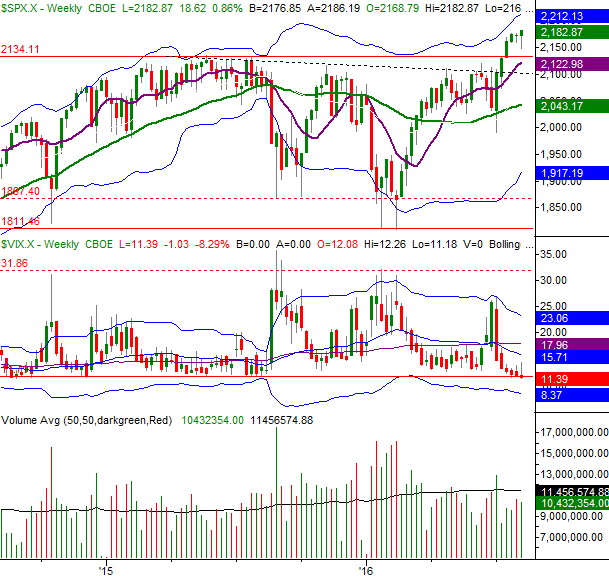
Chart created with TradeStation
While we have to be prepared for a downside move, we don't yet have any evidence of that materializing; the momentum is still bullish. Indeed, the S&P 500 could peel back to 2134 and still not be in a downtrend worth worrying about. By that time the S&P 500's 50-day moving average line (purple) will be right there, lending a supportive hand.
The trick here is not over-reacting... not mistaking a blip for an omen of something bigger.
Industrials Offer Value, But Not Growth
Q2 earnings season is about two-thirds over, but no sector is as finished with its second quarter reports as the industrial sector (XLI); 78% of the industrial stocks in the S&P 500 have reported last quarter's numbers. That's enough to take a look and start drawing some conclusions.
The vital stats: Three-fourths of the industrial names topped estimates, while 15% missed. Not bad... better than average. Then again, the average year-over-year earnings growth rate for the sector is a modest 1.9% in the second quarter. That figure is part of an unimpressive streak of tepid earnings reports.
The pros do expect a return to more normalized growth rates going forward, in the 8% range. In the meantime, the trailing P/E of 18.0 is palatable, as is the forward-looking P/E of 16.1. The chart of the S&P 500 Industrial Sector Index below, with its earnings history and outlook as well as its trailing P/E ratio tells the tale.
S&P 500 Industrial Sector Index Earnings, Valuation Chart
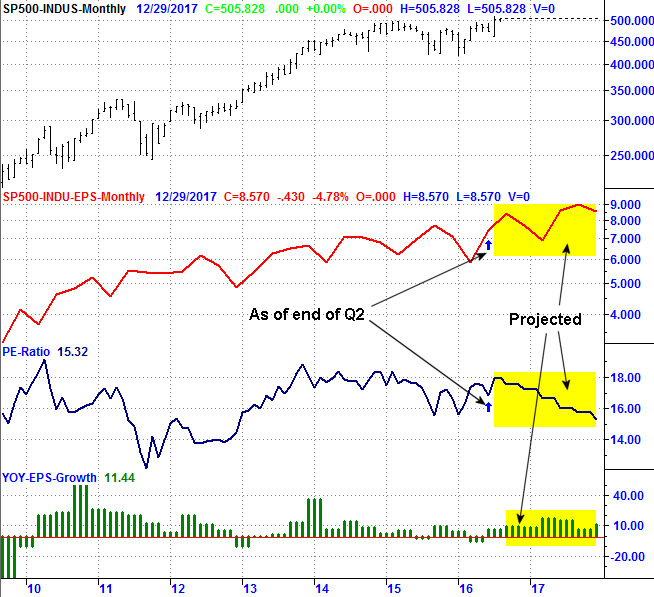
Source: Standard & Poors
Broadly speaking, the sector has value in its consistency. It's not a likely source of major long-term growth though.
Trade Well,
Price Headley
BigTrends.com
1-800-244-8736