Weekly Market Outlook - Momentum, Economy & The Fed
Stocks may have ended the week with a gain last week, but it didn't end the week on a bullish note. Every bit of last week's 0.9% advance (and then some) was reaped on Monday, with the market drifting lower over the course of the last three days of the week.
Still, stocks hang in the balance between bullishness and bearishness... squarely in the middle.
Surprisingly, big unemployment news didn't rock the market out of its rut. Don't assume Friday's employment report can't still have a market-moving impact this week, though. It's taken a lot of recent economic data two or three days to start getting traction in investors' minds.
With that as the backdrop, a deeper look at last week's biggest economic news is merited.
Economic Data
While last week's economic dance card was full, the only item of any real interest was Friday's snapshot of October's unemployment situation.
What you likely already know: In October, the unemployment rate fell to a multi-year low of 5.0% following the creation of 271,000 new jobs. It was a much-needed piece of evidence that the economy can and will create a significant number of jobs after several months of lackluster job growth.
Unemployment and Job Growth Chart
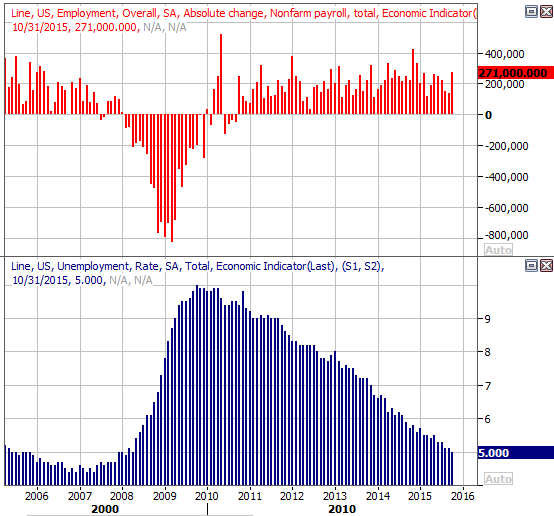
Source: Thomas Reuters
What's a little more obscure: While payroll growth and sinking unemployment point to employment progress, those are hardly the only measures saying this job growth trend is real, healthy. The hourly earnings rate advanced 0.4% last month (versus expectations for a 0.2% increase). That prolongs a long-term growth trend in wages, but it's worth adding that employers aren't offsetting higher pay with fewer hours. Last month, the average number of hours worked rolled in at 34.5 hours per week, where it's stabilized for quite some time.
Average Wage and Workweek Growth Chart
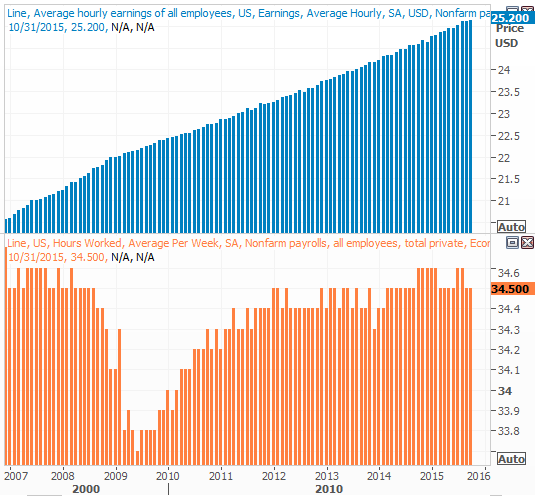
Source: Thomas Reuters
Finally, although it's not one of the data sets usually touted in the monthly employment report, the total number of people with jobs continues to rise, while the total number of people without jobs (officially or unofficially) continues to broadly drift lower. As of last month, 142.654 million people in the United States have jobs.. a record. Conversely, though the number of people unemployed (receiving unemployment benefits) plus the number of people not working but also not receiving unemployment benefits lifted slightly, both of those figures are trending downward.
Employed, Unemployed Chart
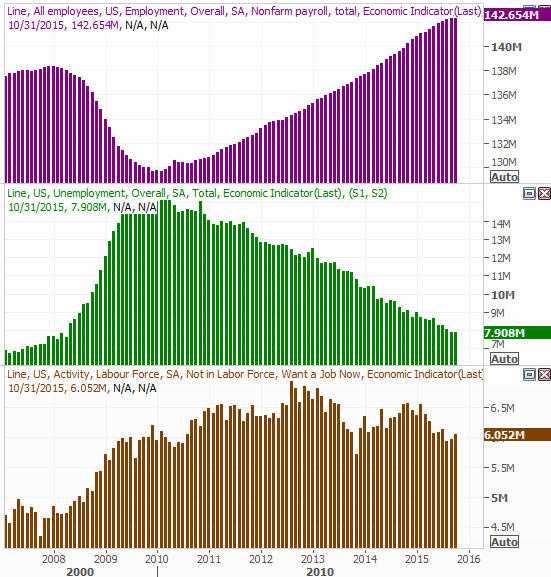
Source: Thomas Reuters
Given the depth and breadth of the encouraging jobs data, it has to be acknowledged that this aspect of the economy is making solid forward progress even if other aspects of it are stagnating.
Everything else is on the following grid:
Economic Calendar
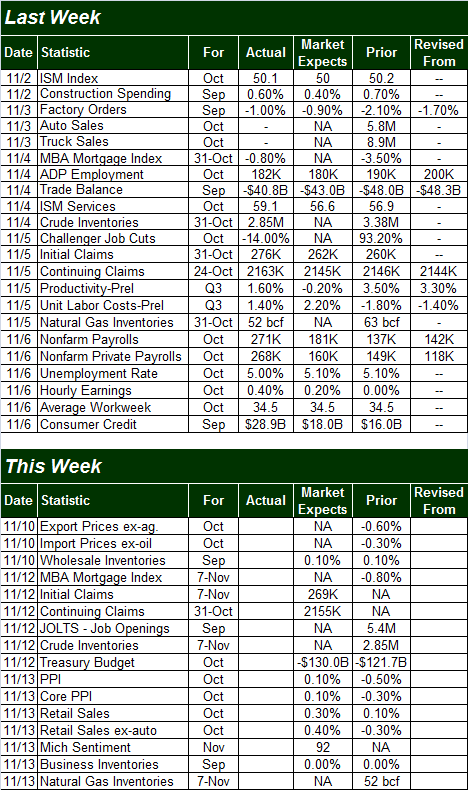
Source: Briefing.com
This week won't be as busy for economic reports, nor as important. In fact, the only item of real consequence is Friday's retail sales data for October. Look for decent growth, with or without automobiles.
Stock Market Index Analysis
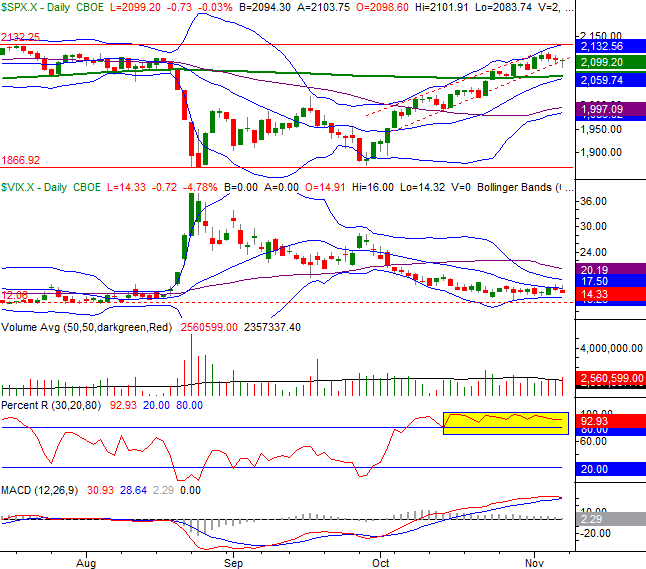
From a momentum perspective, the bulls are still in charge. The S&P 500 (SPX) (SPY) remains above all the key moving average lines, while the Percent R line is still holding above the key 80 threshold [highlighted in yellow].
S&P 500 & VIX Daily Chart
Chart created with TradeStation
On the other hand, there's reason to be very cautious here... even more so than usual. Although it hasn't happened yet, we're very close to a bearish MACD crossunder this week. In fact, if the market doesn't make measurable forward progress soon, we will get that bearish MACD crossunder this week; we're already putting a lot of pressure on the lower edge of the floor of the near-term bullish channel (dashed).
Don't freak out too much if that should happen, however. The "big" floor is around 2060, where the 20-day moving average line and the 200-day moving average line (green) are about to converge. It would take a move under that level to really say the uptrend had been decidedly broken. Any of the other signs are simply a warning that the uptrend was waning.
Another hypothetical question to mull: Is the CBOE Volatility Index (VIX) (VXX) simply unable to break under an absolute floor around 12.0? If so, then the cap has already been put on the market's rally.
Zooming out to the weekly chart of the S&P 500 we can sense that, even though the trend remains bullish, it's slowing down; the distance between the weekly closes and the weekly high are getting bigger, suggesting stocks are struggling to retain their gains. It's also on the weekly chart we can see the VIX is near - though not quite at a significant floor.
S&P 500 & VIX Weekly Chart
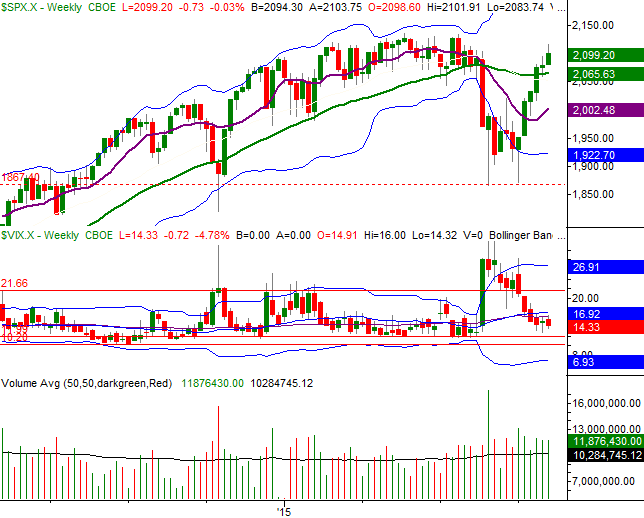
Chart created with TradeStation
Still, the bulls are mustering strength in the places where they need to muster it most. One of those places in from small cap stocks.
Last week we pointed out the Russell 2000 Small Cap (RUT) (IWM) Index was toying with the possibility of an upside-down head-and-shoulders(ish) pattern, which would serve as a big bullish clue. We got it. The Russell 2000 thrust above a ceiling at 1180, and at the same time pushed above the 100-day moving average line (gray). We'd still like to see the Russell break above the 200-day moving average line at 1216 before getting all the way in the bullish camp, but that's the direction this index is pointed.
Russell 2000 Daily Chart
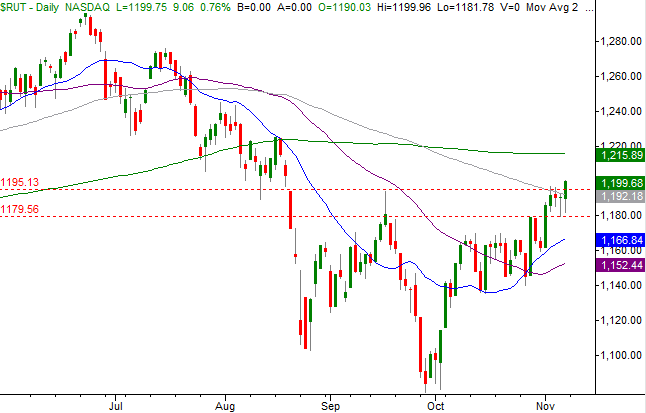
Chart created with TradeStation
In that same vein, the NASDAQ Composite (COMP) needs to punch through the recent ceiling at 5232 to say the momentum is decidedly in favor of the bulls. The NASDAQ, however, looks like it's still got a lot of its recent undertow working in its favor.
NASDAQ Composite & VXN Daily Chart
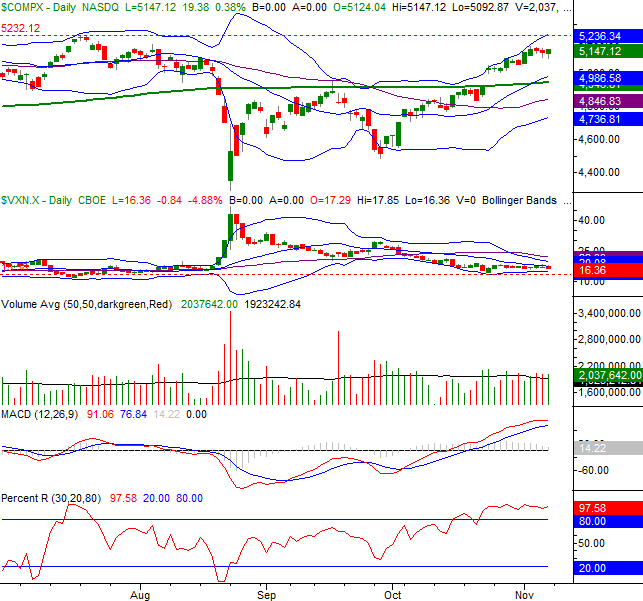
Chart created with TradeStation
This is very much a "stuck in the middle" scenario. The best vantage point may be watching from the sidelines for a while... until one side or the other takes firm control.
December Rate Hike Now Presumed Likely
To say a great deal has changed in the past two weeks regarding interest rates would be an understatement of immense proportions. Two weeks ago, the prospect of a Fed Funds rate hike of even a mere 0.25% - to 0.5% - was something not expected until March of next year, and even then it was a "just barely" prospect.
Now, in the shadow of comments from Fed chairwoman Janet Yellen as well as Friday's surprisingly strong employment numbers for October, traders are decidedly counting on a December interest rate increase.
The charts below tell the story. The first one was the interest rate outlook and predictions as of two weeks ago. The second one is the outlook and odds as of Friday of last week.
Fed Funds Outlook Chart, as of October 26th
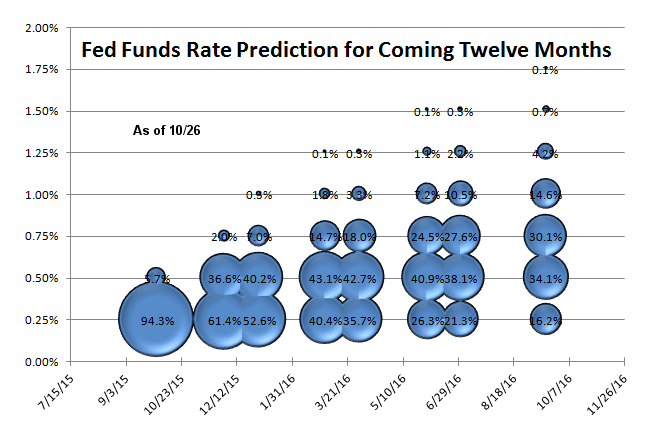
Source: CME Group
Fed Funds Outlook Chart, as of November 6th
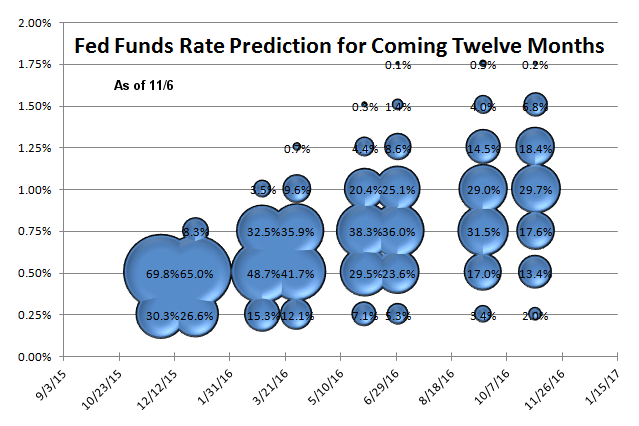
Source: CME Group
Then, the Fed Funds rate would have struggled to reach 0.5% by late-2016. Now, the Fed Funds rate will have a struggle to not exceed 1.0% by late-2016... at least according to the way Fed Funds futures are priced, and trading.
Trade Well,
Price Headley
BigTrends.com
1-800-244-8736