This Rally Effort is Healthy, Even if Not Huge
At the beginning of April, we pointed out that the breakout effort at the time may have been stronger than many had presumed. The reason? More stocks were participating in the rally effort than we'd seen in months, and more stocks were exhibiting a level of technical strength than we'd seen in months.
Beginning the very next day, the bulls started to stumble, with the indices starting to log more lower lows and lower higher than higher lows and higher highs. As it turns out, however, traders could have -- and still can -- trust the key bullish clues discussed then. In fact, both indications of that bullish undertow have been refreshed in the meantime, telling us a rekindled bullish divergence is underway.
The less-important of those two clues at the time was the portion of NYSE stocks above their 200-day moving average line, and the portion of NYSE stocks below that key technical analysis line. At the time we had just seen that data turn positive - with more stocks above their 200-day lines than below them - but in the meantime we've seen that bullishness widen. As of today, 63% of NYSE stocks are above the 200-day moving average line, and only 37% are below that line. That's the best we've seen since September of 2014.
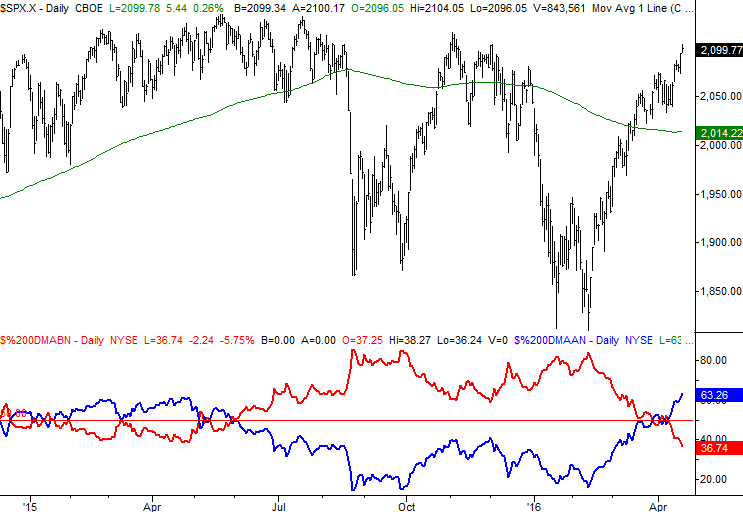
It's not a hollow rally either - the bulls are out in force.
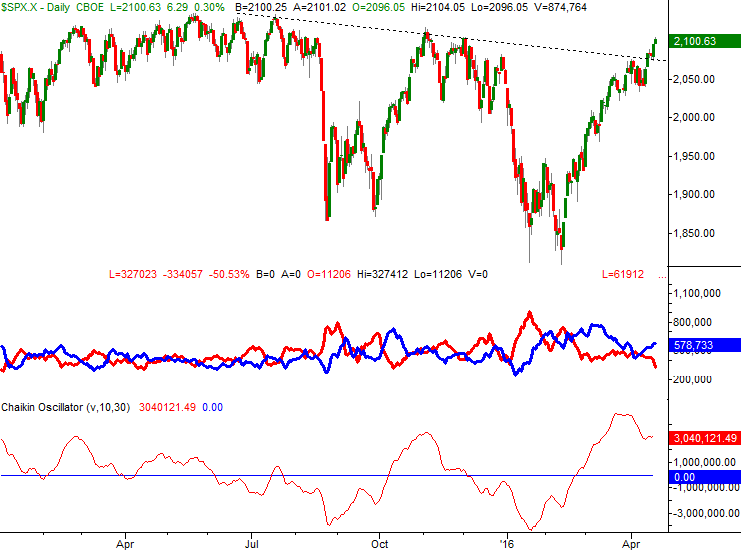
The other element to that initial analysis considered volume, since participation - or volume - in a rally is necessary to sustain it. At that time, the volume of NYSE advancers had handily surpassed the volume logged by the NYSE's losing stocks. That volume undertow was confirmed by a Chaikin line (a volume-weighted momentum indicator) that was well above the zero level, and just coming off multi-month highs.
Though in positive territory at the time, both tools were also waning. Since then, both tools have begun a new bullish divergence. The new divergence took shape at the same time the S&P 500 hurdled what could have become a major technical ceiling (dashed)
There's still a chance the market could hit a headwind; all of the aforementioned tool run hot and cold, even when well into bullish territory. They're an indicator of a much bigger undertow though, and unsurprisingly, they accurately indicated the current breakout effort would take shape before it materialized. Now they're saying that broad uptrend should last.
Just bear in mind that these tools only suggest direction, not degree. That is, they say the trend should be bullish for the foreseeable future, but that trend may or may not carry stocks significantly higher. Frothy valuations are apt to create part of any headwind.