Why The Current Rally May Have Legs (Unlike Last October)
The Bullish Case for a Breakout is Better Than it Was With the Previous Rebound Effort
Some of the most dangerous words to believe when it comes to trading are "this time it's different." Yet, although risks still abound and anything can still happen at any time (with or without warning), there really is something different about the current rally effort that we didn't see with the previous rebound effort from October... which failed. This time, the rally has more participants, and the stocks leading the way are on firmer footing.
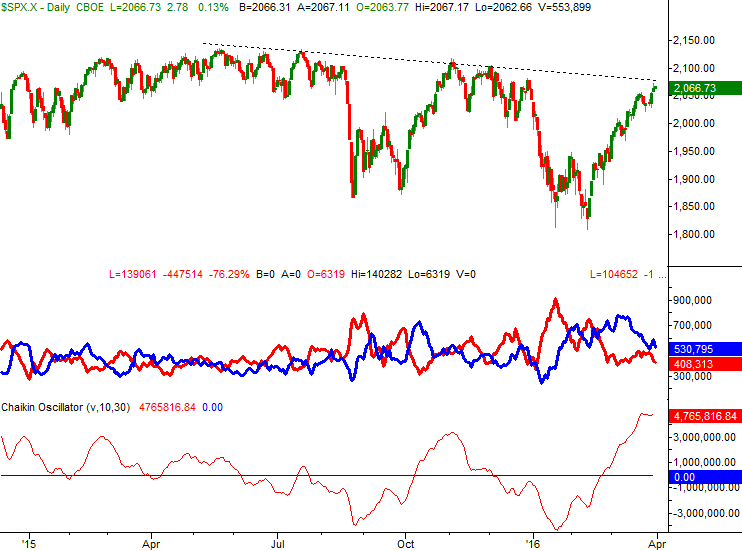
First and foremost, know that the S&P 500 (SPX) (SPY) -- our proxy for the broad market -- is on the cusp of punching through a key resistance line (dashed) that extends back to the middle of last year. Helping to frame that line is the peak from October's rebound effort. It's all plotted on the chart below, as are some key volume indicators.
In the middle portion of the chart, the two volatile intertwined lines plot the NYSE's "Up" volume (blue) and "Down" volume (red) trends; they're moving averages of the daily reading for both numbers. Although the "Up" volume trend is falling, is still considerably stronger than the "Down" volume trend it hurdled in February. In fact, this is the longest stretch of net-positive volume we've seen from the NYSE in many, many months. And, even though it's waning, the current average "Up" volume is still above the long-term norm.
On the bottom of the chart you'll see a Chaikin Oscillator line.
In simplest terms, a Chaikin line is a volume-weighted momentum indicator. A bullish trend without a great deal of volume behind it isn't necessarily a bullish trend that's built to last, and vice versa. As such, a firmly-rising Chaikin line suggests a bullish trend also has a healthy amount of volume behind it that could make it last a while. And, as you can see, the Chaikin line is broadly rising, having reached a multi-month high using our setting.
The bears will point out that the Chaikin line also reached a multi-month high in October, and that didn't lead to more bullishness. And, the bears make a valid point - there's no absolute guarantee the current uptrend won't end the same way. A closer look at October's rollover from the Chaikin Oscillator, however, reveals that volume waned before the S&P 500 pulled back in a big way. Assuming the same will happen this time (and this is usually the case with the Chaikin Oscillator), if the rally is doomed the Chailkin line will send a clear message beforehand by virtue of a rollover and subsequent pullback. We don't have that signal yet; the current stagnation from the Chaikin line mostly stems from last week's holiday-lightened trading volume.
Bolstering the bullish case is a comparison of the number of NYSE stocks above their pivotal 200-day moving average line (blue) and the number of NYSE stocks below their 200-day average (red), which is plotted on the lower half of the S&P 500's chart below. For the first time since May of last year, more stocks are above their 200-day moving average line... 52% to 48%, to be exact.
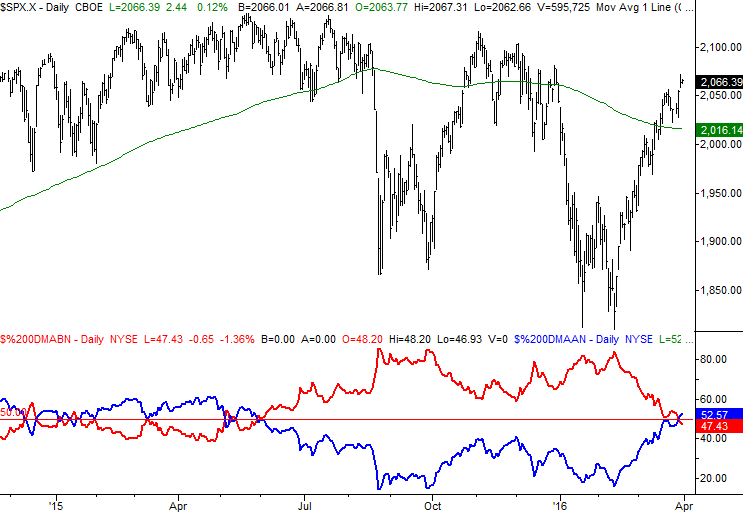
It matters, because traders tend to view the 200-day moving average line as a key psychological line in the sand. Now that the majority of stocks have managed to fight their way back above those long-term lines, investors are more apt to do whatever it takes to keep them on that side of the moving average line.
Again, never say never. From an odds-making perspective though, the bullish case now is a heck of a lot better than the bullish case from October was. Now, if the S&P 500 can just get above that resistance line and consummate this effort...