Key Levels & Fed Expectations - Weekly Market Outlook
The market never could get the rebound rally from two weeks ago restarted last week. In fact, between Tuesday's near -3% stumble and Friday's 1.5% lull, the S&P 500 (SPX) (SPY) finished the week on the defensive more so than the offensive. The bulls still have their work cut out for them. And yet...
While stocks are facing the wrong direction, stocks are still on the fence, and the right nudge -- whether it be a recovery in China or some encouraging interest rate news from the Fed -- stocks are still within reach of a renewed rally. The only impasse with a rebound now rather than later is, it will make the typical Q4 rally less impressive than usual.
We'll explore all the technicals below, following a closer look at this week's major economic news... namely, last month's employment figures.
Economic Data
Last week was loaded with data, though the only economic news that really mattered was Friday's employment data for August. The 173,000 new jobs added last month missed estimates for 217,000, but it was still enough to drive the unemployment rate down from 5.3% to 5.1%.
Unemployment Rate and Job-Growth Chart
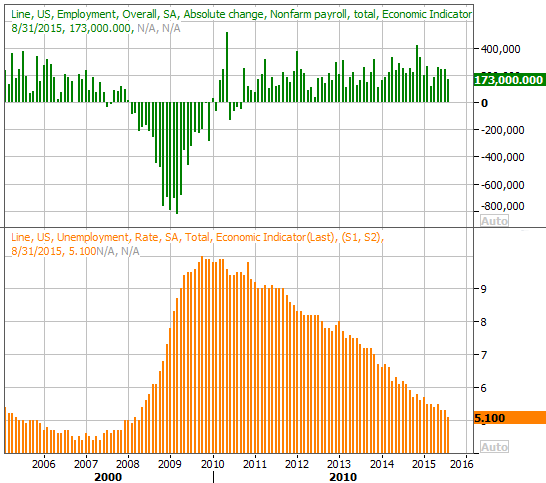
Source: Thomas Reuters
The slow and steady growth of employment - and equally steady decline of unemployment - is undeniable. The unemployment rate now stands at the lowest level we've seen in seven years, and while the improvement hasn't always been the highest-quality progress we would have preferred, it never is. This is a pretty solid situation. If companies aren't doing well, it's not because enough consumers just aren't capable of spending.
The flipside: This level of employment strength makes it easier for the Federal Reserve to justify a rate hike this month, after it looked like one had been staved off. How the market behaves between now and then may also play a role in that decision. It's unlikely Janet Yellen will want to put a rate-hike program in place while the market is imploding.
Everything else is on the following grid:
Economic Calendar
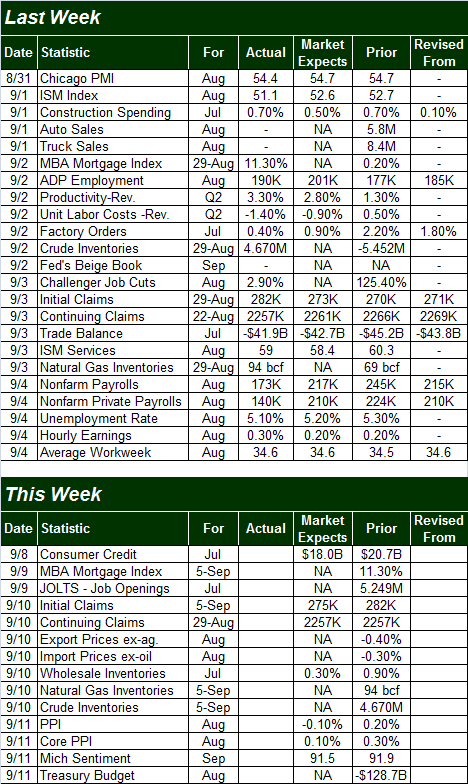
Source: Briefing.com
This shortened trading week is going to be light in terms of economic news, and little of it is of it is earth-shattering. The only item of any interest is Friday's producer price inflation data, and that's only as a hint of what to expect next week on the consumer inflation front (another one of the items the Fed has in mind in its rate-hike equation). Both the PPI and the CPI annualized rates are on the chart below.
Inflation Rate Chart
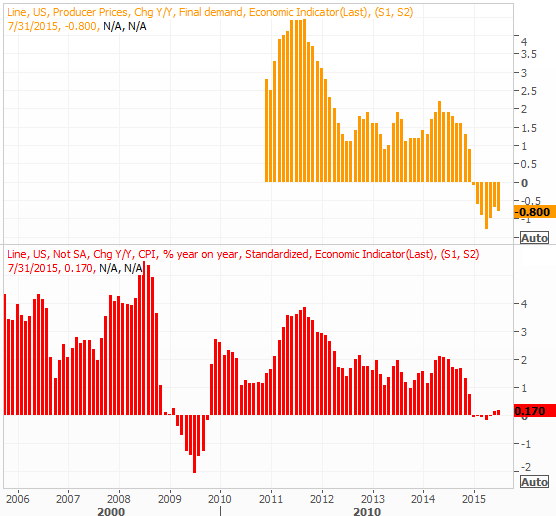
Source: Thomas Reuters
Stock Market Index Analysis
With just a look at the near-term daily charts, although last week's losses logged a second big losing week in the last three, it appears the bulls have left themselves a way of bringing all of this turbulence to a close and coming out of it in a bullish direction. When one takes a step back and looks at the longer-term weekly charts, the depth of the damage becomes clear, and troubling. We've now dropped some decidedly-bearish technical hints that will be tough to shrug off now.
With that as the backdrop, let's look at the weekly charts first this week, so we have the proper perspective when zooming into the daily charts.
Here's the weekly chart of the S&P 500. We closed under the lower 26-week Bollinger band three weeks ago for the first time in years. We continued to move sharply lower in the early part of the following week, but the bulls pushed back later in the week to make a big, hammer-shaped reversal bar that week. That was a key bullish sign, and the market's best bet to rekindle the rally. That best shot ultimately fizzled out, however, with the S&P 500 making a major lower close just last week. This failed reversal clue speaks volumes about the market's true mood right now, which doesn't bode particularly well.
S&P 500 & VIX Weekly Chart
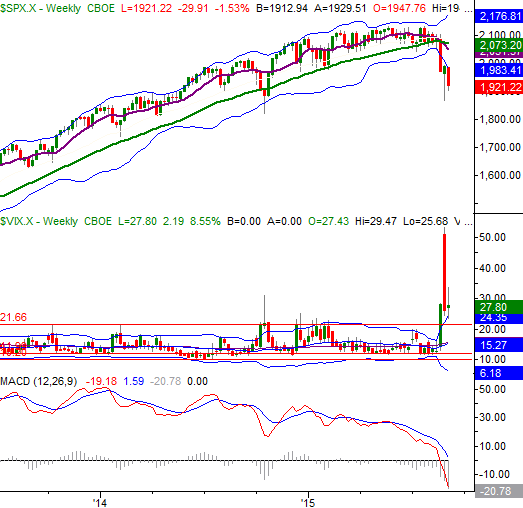
Chart created with TradeStation
On the flipside, one of the best aspects of this pullback so far is its size. The S&P 500 is now 10% off of its July high, and had been as much as 12.4% below it two weeks ago. There's still room for it to move a little lower, but a move of that size has already burned off a good deal of the market's froth.
The weekly chart of the NASDAQ Composite (COMP) doesn't offer any more encouragement. It too has made its second close below the lower 26-week Bollinger band, but more than that, it's putting some last-ditch pressure on the last of any meaningful straight-line support levels (dashed).
NASDAQ Composite & VXN Weekly Chart
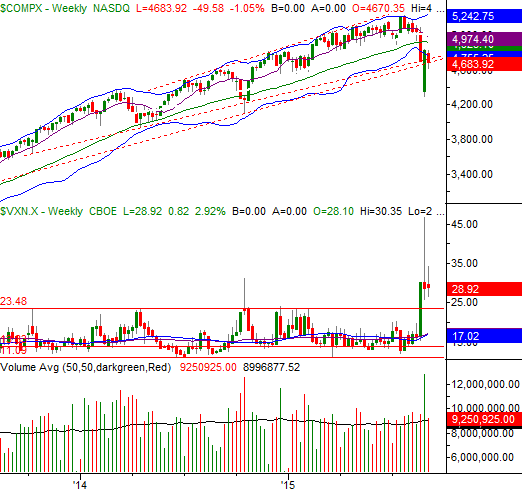
Chart created with TradeStation
Zooming into the daily chart of the NASDAQ Composite isn't so alarming. There's a basic "path" between the lower 20-day Bollinger band and the 20-day moving average that subtly suggests the composite should move lower, but clearly the composite isn't absolutely convinced that's the path it should follow. It's still relatively within reach of a break above the critical 50-day moving average line at 4985, and the Nasdaq Volatility Index (VXN) is drifting lower...which is bullish for stocks.
NASDAQ Composite & VXN Daily Chart
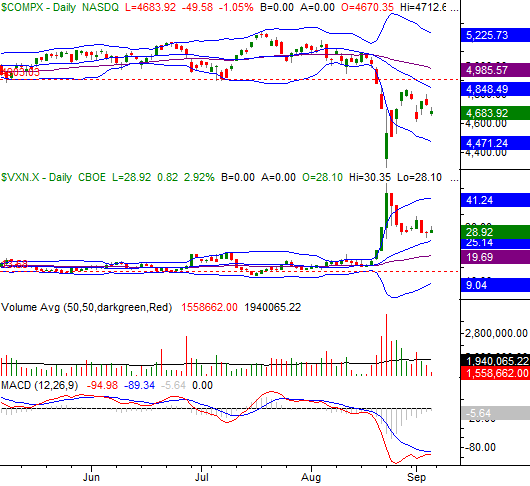
Chart created with TradeStation
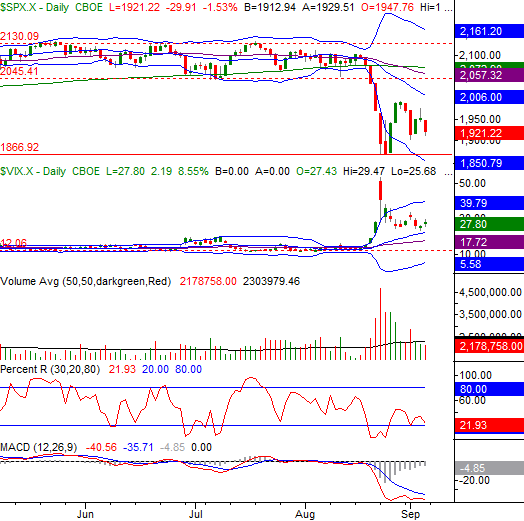
Ditto for the S&P 500. That is, it's presently in no-man's land, and could still plausibly end up below 1866 or above the key 2060 level before it's all said and done. The thing is, it could bounce around between those two lines for a while, telling us nothing about its true undertow. Such a stagnation is the least desirable outcome for traders, since movement - up or down - is necessary for most trading.
With all of that being said, the Percent R indicator (using the BigTrends smoothed method) is closer to bearishness than bullishness, and that's the tool we'll be keeping the closest eye on from here.
One of the techniques we teach (and use) is a confirmation of a downtrend via a Percent R line that renews a downtrend without ever breaking above the 20 threshold on the same day the index in question makes a lower low. In simpler terms, we're on the lookout for a Percent R line that gets AND THEN STAYS below the 20 level. [This is an oversimplified explanation, but it does capture the premise.] Now take a look at the Percent R line on the daily chart of the S&P 500 below. It would take very little weakness to confirm a downtrend using that as the criteria.
S&P 500 & VIX Daily Chart
Chart created with TradeStation
The challenge is being patient enough to let one scenario or the other play out and then following. But, that's the right move to make at this time.
With that in mind, it makes sense that the BigTrends TrendScore for stocks at this point is in neutral territory.
Fed Funds Rate Predictions
Incredibly enough, despite last month's sharp decline in the unemployment rate and renewed (relative) stability in the equity market, traders think there's less of a chance of a rate hike this month than there was a week ago. Perhaps the weak-ish 173,00 new payrolls and a stock market that didn't snap back let the market come to the conclusion that the economy is even less able to withstand higher interest rates than first presumed.
The numbers: Last week, the Fed Funds futures market said there was a 72.1% chance the Fed Funds rate would remain at 0.25%, and there was a 27.9% chance it would be pushed up to 0.5%. Now traders are implying an 81.1% chance it will hold at 0.25%, and an 18.9% chance of it being bumped up to 0.5%.
Federal Funds Rate Futures Rate - Prediction Chart
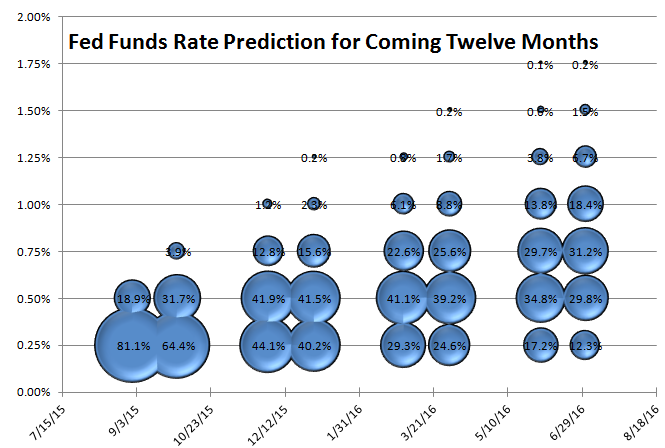
Source: CME Group
The postponement is just that - a delay. These same traders still basically expect rates to be at 0.5% or 0.75% by the middle of next year (a fairly equal chance of either), and the December/January expectations didn't change at all. That is, we've still got equal chances of a 0.25% and a 0.5% Fed Funds rate around the turn of the year.
Trade Well,
Price Headley
BigTrends.com
1-800-244-8736