The market may have peeled back off of its highs hit last week, but even with that dip the S&P 500 (SPX) (SPY) managed to close on Friday a solid 2.0% better than where it ended the prior Friday.
It remains to be seen if stocks can sustain the uptrend; there are strong technical arguments from both sides of the fence. The good news/bad news is, things should come to a head this week and force the bulls and the bears to play their hand. Once they do (for better or worse), the market will get much more interesting and trade-worthy again.
We'll hash out the details after running down last week's and this week's key economic data.
Economic Data
Not only was last week rather light in terms of economic news, little of what we got was of any real interest. In fact, the only data worth exploring was August's inflation data. It's still tame, at an annualized pace of 0.17%, and on a core basis (without food and energy) it's still a manageable rate of 1.8%. It's still below the Fed's target rate of 2.0%, giving the Fed room to hold off on a rate hike this week... if Janet Yellen wanted to.
Inflation Chart
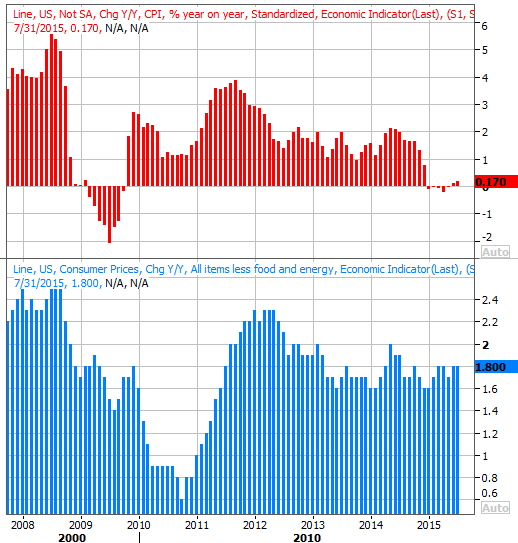
Source: Thomas Reuters
There was a sharp plunge in the Michigan Sentiment Index's first reading for September. The dip from 91.9 to 85.7 is the sharpest drop in years, and the lowest reading in months. But, in that it's the first of three updates to the index, it's too soon to snap to a conclusion there.
Everything else is on the following grid:
Economic Calendar
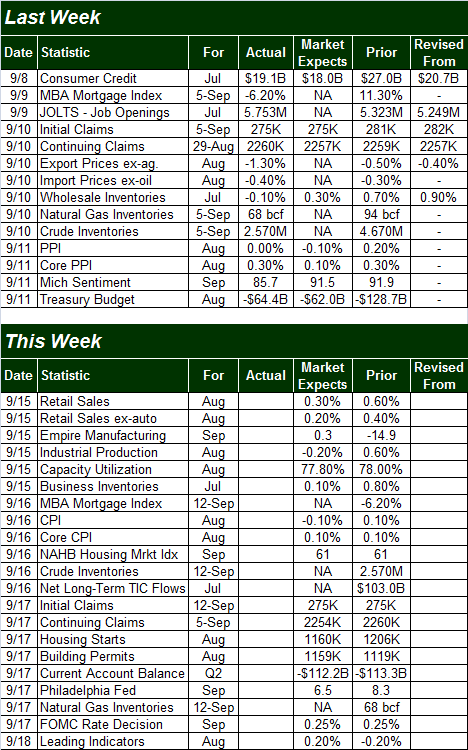
Source: Briefing.com
This week is clearly going to be significantly busier, but two of the items particularly stand out.
The first of those items is Tuesday's retail sales data for August. Economists are calling for a slowdown from July's sales, though the growth figures should still be positive... sustaining a longer-term growth trend.
Retail Sales Chart
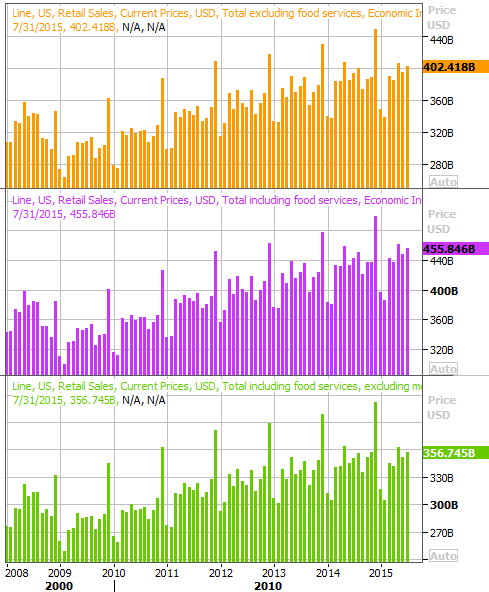
Source: Thomas Reuters
The other data set we'll be watching closely is last month's housing starts and building permits. They've both been wild of late, though each has remained in long-term uptrends. Last month's numbers are projected to be pretty similar to July's, but a big beat or shortfall could shake the market up a little.
Housing Permits & Starts Chart
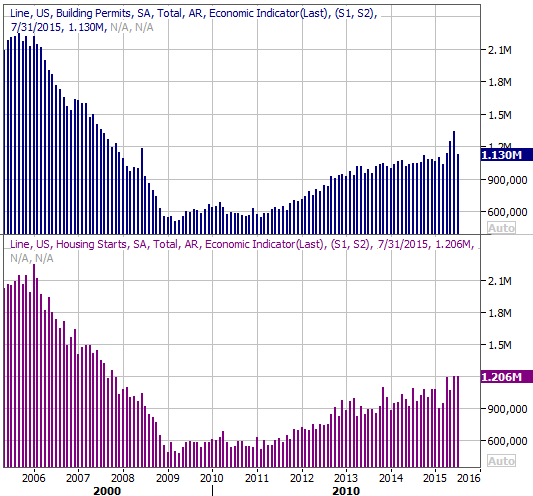
Source: Thomas Reuters
The main event, however, is obviously going to be Thursday's decision from the Federal Reserve regarding the Fed Funds rate. As of right now, traders are mostly betting there will be no change in the 0.25% rate. There's a chance trading could be relatively contained up until the decision is released.
Stock Market Index Analysis
As was noted, the market made gains last week, but it's still difficult to say the market is back in a long-term uptrend. The short-term trend is bullish, to be fair, but even that uptrend has a couple of stumbling blocks. Traders (still) need to be prepared for anything. We'll take close looks at both scenarios.
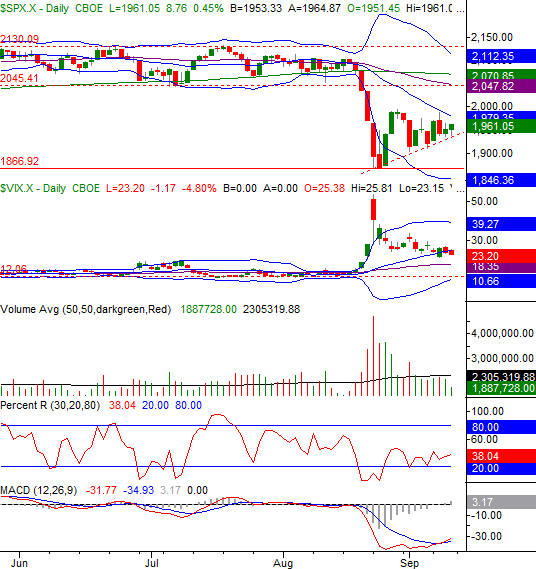
As of Friday, the S&P 500 is in bullish made... for reasons beyond the week-to-week gain. Namely, we have a new bullish MACD crossover, and we've left behind a well-organized string of higher lows (see the rising dashed line) since the August 25th low. Also if you look closely, the CBOE Volatility Index (VIX) (VXX) finally pulled back under its 20-day moving average line.
S&P 500 & VIX Daily Chart
Chart created with TradeStation
It's not, however, anything close to an ideal uptrend yet.
The biggest impediment is the S&P 500's 20-day moving average line, currently at 1979.35. You only have to look back to Wednesday to see how a mere brush with the 20-day average put a pretty good pullback into motion. It's unlikely the 20-day average stopped being a key line in the sand.
And even if the S&P 500 does happen to clear its 20-day moving average line, there's still a much thicker layer of resistance around 2050 where the 50-day (purple) and 200-day (green) moving average lines are laying in wait to halt any uptrend dead in its tracks.
The weekly chart of the S&P 500 once again puts all of this in perspective. The drubbings from two and four weeks ago were so severe [we were down 14% from high to low at one point], there's room for a big dead-cat bounce without actually shoving stocks back into a bigger-picture uptrend. It's in this timeframe we can see just how much things changed when the uptrend was snapped in mid-August.
S&P 500 & VIX Weekly Chart
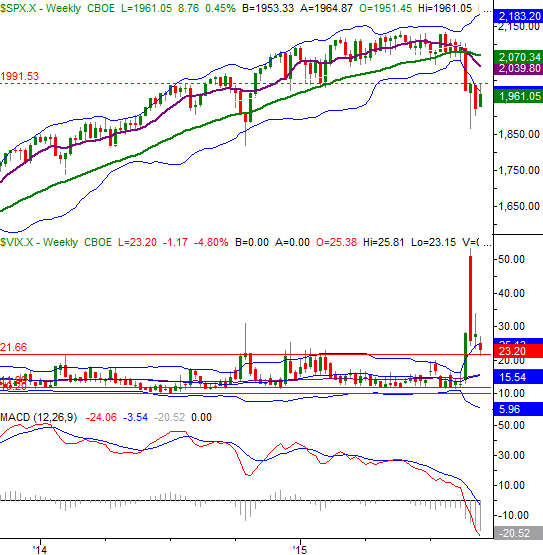
Chart created with TradeStation
In the weekly timeframe we can see there's a weekly ceiling at 1991.5, and if that resistance is broken, there's a little room to run before another big headwind is hit; the VIX has room to sink before finding a major floor as well. But, even so, the longer-term technicals remain on the bearish side of the fence.
The short run remains a coin toss, though the convergence of short-term support and resistance means we should see a decent near-term move soon. The direction of that move, though, is still a 50/50 proposition at this point. Just look for the break above the aforementioned resistance or below the support at 1934.
U.S. Dollar on Verge of Breakdown
With much of the recent focus on the impending interest rate decision, traders have taken their eyes off of the U.S. dollar (UUP). Big mistake. It's quietly getting close to a game-changing floor.
The U.S. Dollar Index chart below isn't tough to interpret. We've seen it make a string of lower highs since March, and we've also seen it break under a rising support line at least once since May. It's putting pressure on the support level now, at the same time it's putting pressure on the critical 200-day moving average line (green). Already underneath some key short-term moving average lines - lines which also happened to be sloped downward - just a little more downside could snap some very fragile support and really open the floodgates.
U.S. Dollar Index Chart
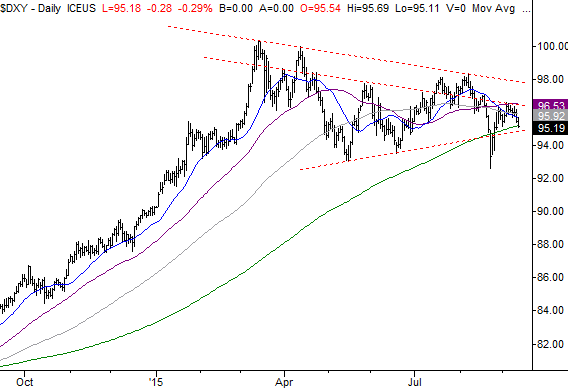
Chart created with TradeStation
It's doubly alarming that this is happening now, as the interest rate environment is being shaken up by a potential Fed Funds rate hike. Broadly speaking, higher interest rates increase the value of the corresponding currency. But, if there was ever an opportunity for an exception to that norm, this is it.
Trade Well,
Price Headley
BigTrends.com
1-800-244-8736