Let's take a look at the biggest Biotech ETFs, as this was one of the market's top sectors for several years and has recently undergone a pretty strong correction.
As you can see on the following table, there are currently only 2 pure sector play Biotechnology ETFs that trade over 1 million average daily volume (XBI) (IBB) -- but there are 5 that have options trading available (XBI) (IBB) (FBT) (BBH) (SBIO). Caution on the option liquidity on some of these, other than IBB -- use limit orders to avoid potentially bad fill prices. We've omitted Inverse & Ultra ETFs from our analysis.
Table
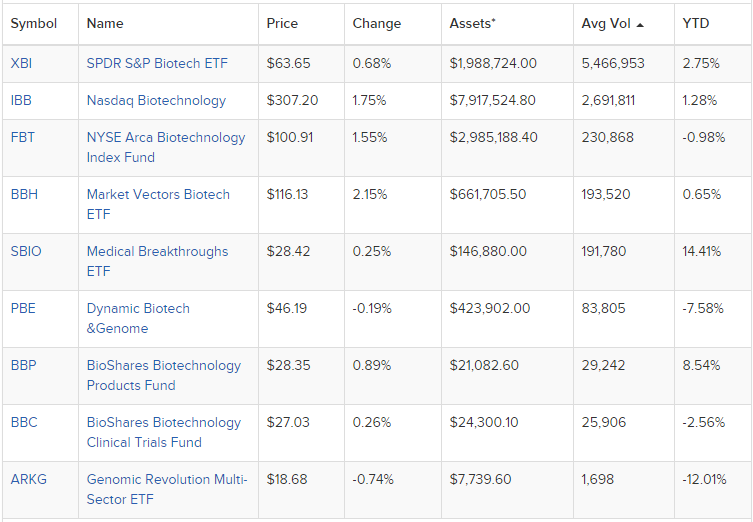
Source: etfdb.com
You can see from the Year-To-Date (YTD) returns that the ETFs within this sector differ greatly -- the gain/loss this year ranges from -7.6% to +8.5%.
Holdings/Expense Ratio:
The difference in these ETFs largely comes from the holdings (and expense ratio) -- here are the expense ratios of these ETFs currently (holdings and expense data from Yahoo Finance):
XBI = 0.35%
IBB = 0.48%
FBT = 0.58%
BBH = 0.35%
SBIO = 0.50%
For comparison, Biotech Mutual Funds range from 0.78% to 2.18% expense ratio, and many of these have Loads/Feeds that add additional costs -- in general, ETFs are a better bargain for active investors than Mutual Funds.
Let's look at the top holdings and diversification of these ETFs, to see similarities and differences:
Top 10 Holdings:
XBI has 11.8% of assets in its Top 10 Holdings -- (RDUS) (MYGN) (JUNO) (INFI) (MDXG) (EXEL) (BIIB) (EXAS) (ABBV) (ALXN)
IBB has 60.3% in its Top 10 Holdings -- (BIIB) (GILD) (CELG) (AMGN) (REGN) (ALXN) (ILMN) (VRTX) (INCY) (MYL) -- the first 5 of those are each around 8% to 9% of total assets.
FBT has 39.3% in its Top 10 -- (MYGN) (GRFS.BC) (QGEN) (INCY) (Q) (TECH) (NKTR) (AMGN) (CRL) (REGN)
BBH has 73.5% in its Top 10 -- (GILD) (AMGN) (CELG) (BIIB) (REGN) (BXLT) (ALXN) (ILMN) (INCY) (BMRN) -- top 3 are 11% to 16% each
SBIO has 38.5% in its Top 10 -- (SGEN) (ANAC) (RARE) (CVS) (NBIX) (ACAD) (AKRX) (HZNP) (CTLT) (RDUS)
A few things to be gleaned from this:
BBH & IBB are concentrated / basically non-diverse, while XBI is extremely diversified. There is not a definitive answer as to whether a diversified or non-diversified asset is a better bet for active investors -- the price action of the ETF is the most important thing, but certainly the concentrated holdings ones will be heavily influenced by a small group of stocks.
In the case of IBB, currently 5 names that make up 41% of its total assets -- and for BBH there is 39% in just 3 names.
With many overlapping holdings, BBH is sort of an 'IBB-light' -- trading at $116 currently, it is nearly 1/3 the price of IBB. This means its options should be more affordable on a real dollar basis than IBB (IBB options are a bit costly for many small retail traders) -- however, option liquidity (such as bid/ask spreads) is an issue to keep in mind on BBH.
SPDR Healthcare (XLV) is another liquid ETF that can serve as a semi-proxy for Biotech (a less volatile one, more in line with the broad stock market) and which is not listed in the above data. XLV holds health care, pharmaceutical, medical device companies, among others -- but it also holds positions in biotech companies (also, many of the other various names it holds are related to biotech). As an example, in its Top 10 holdings XLV has (GILD) (AMGN) (ABBV). We've used XLV as a trading vehicle at times in our ETFTRADR trade recommendation newsletter service, when IBB is too high priced on its options and the other Biotech ETFs aren't showing adequate option liquidity for our client needs.
Performance:
Below we've plotted these 5 major Biotech ETFs (6 including XLV) compared to the S&P 500 ETF (SPY) on both year-to-date and since the 2009 stock market bottom -- 4 charts below and data from TradeStation:
Relative Performance 2015, Daily
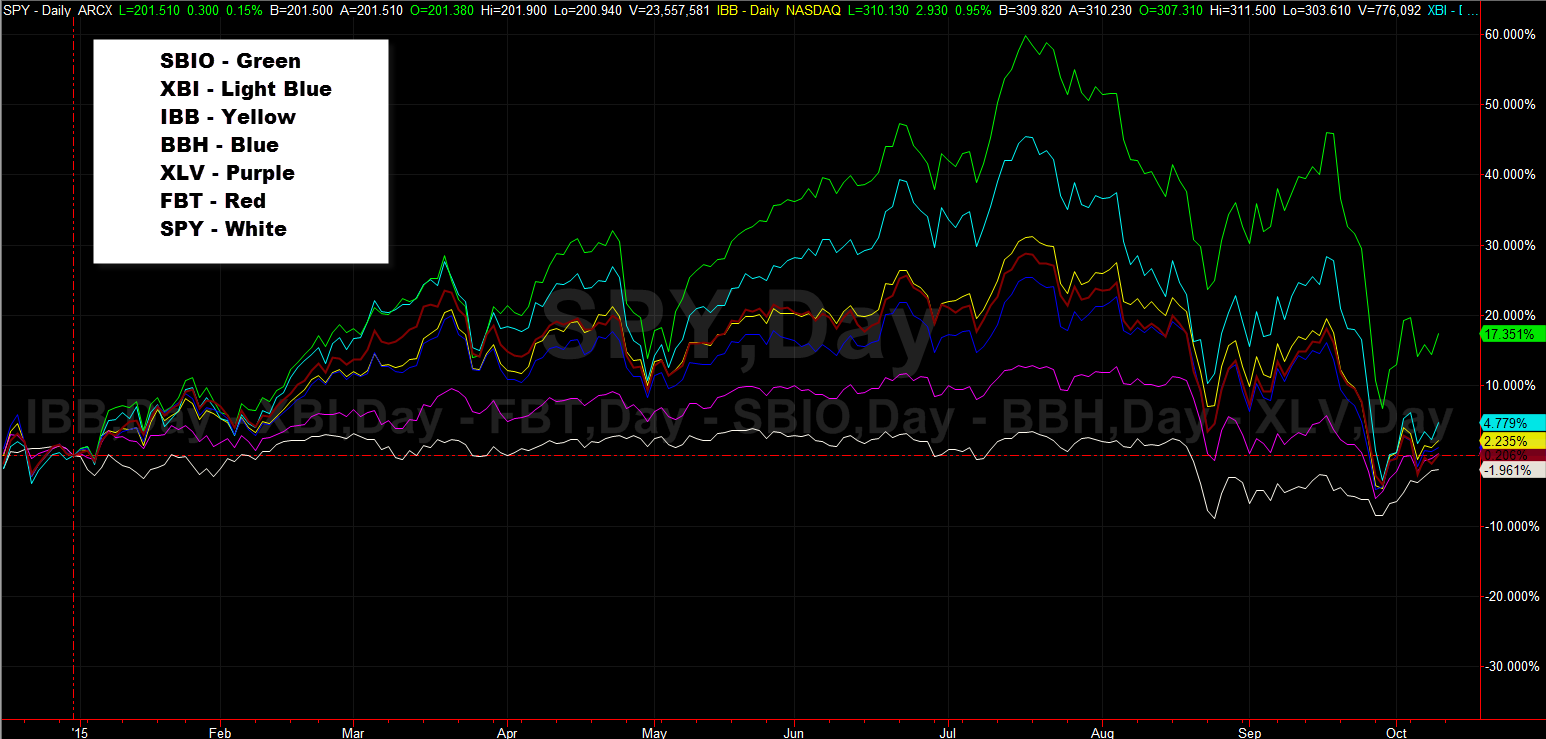
You can see that SBIO is an outperformer in 2015, while the others are bunched in a fairly small performance area.
Relative Performance 2009 to present, Weekly
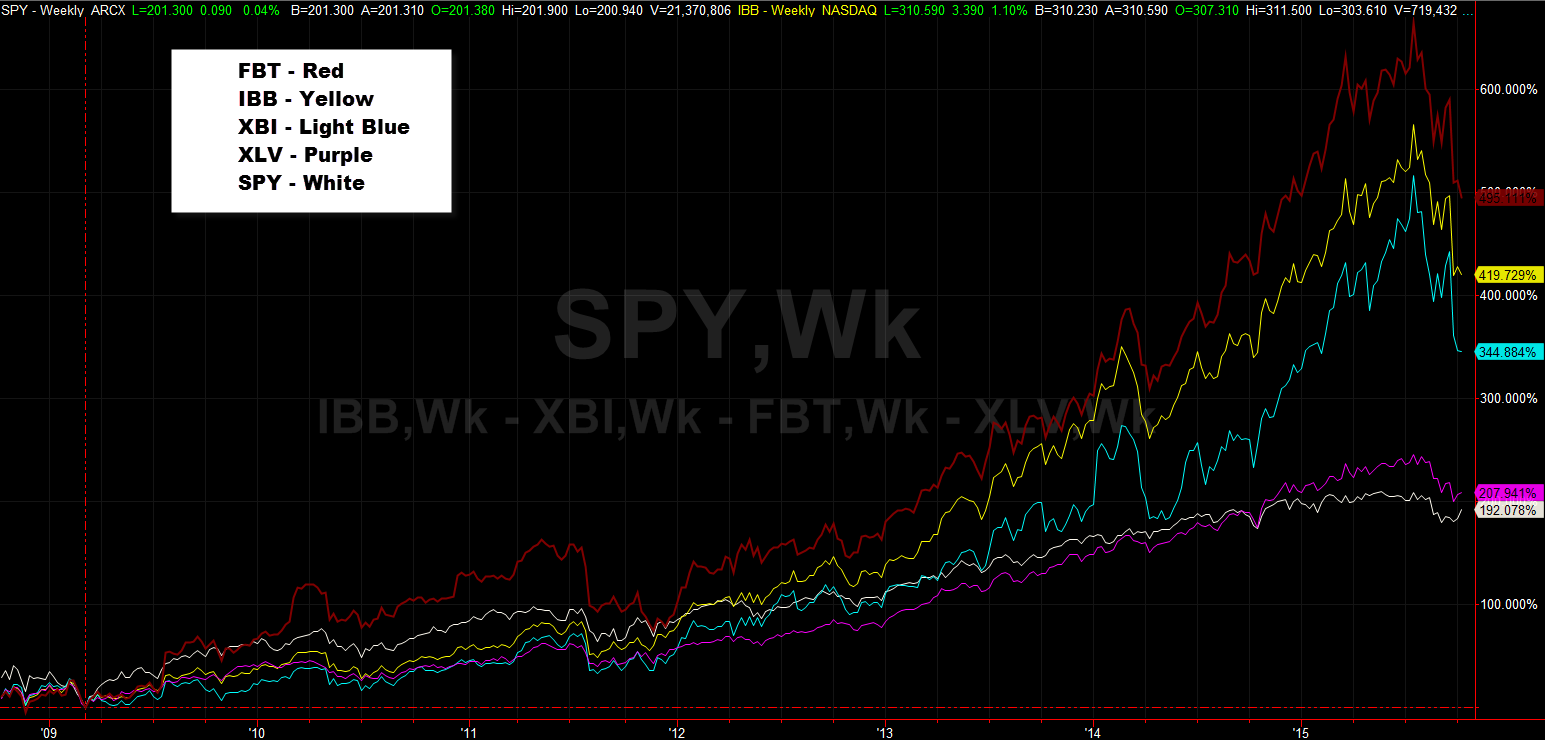
For the bigger picture, since the 2009 '666' stock market panic bottom, Biotechs have had a huge outperforming run and a significant correction this year (note that XLV has basically performed in line with the market over this longer time period).
When an index (or stock, currency, commodity, etc) has a big run and then a large pullback, it's often useful to place a Fibonacci Retracement on the chart to see likely support areas and key levels -- we'll use IBB for this example:
IBB Long-Term Weekly Chart with Fibonacci Retracement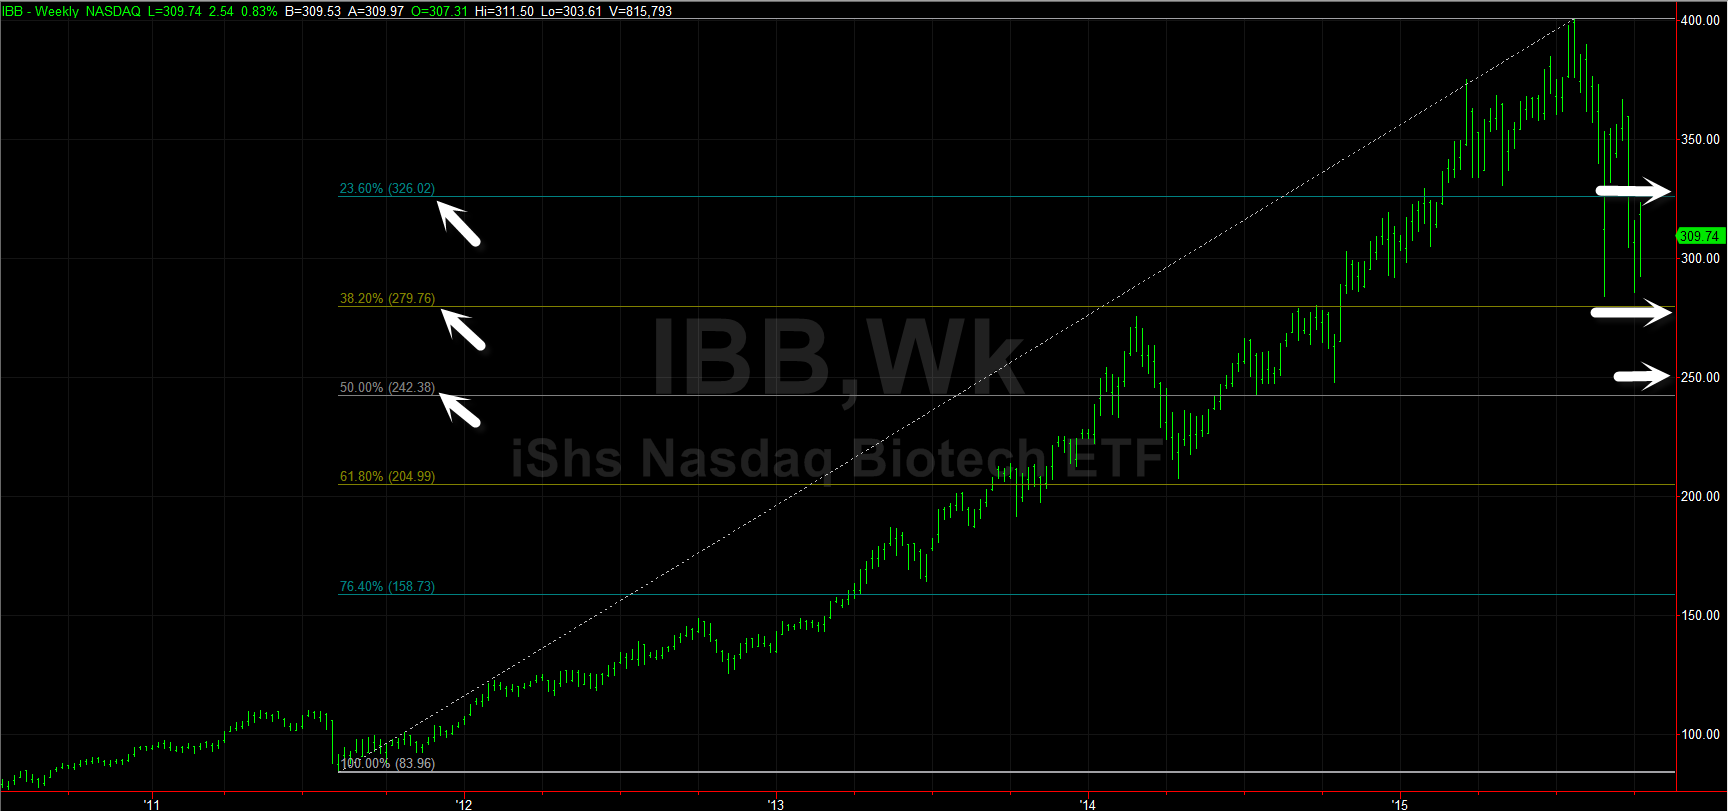
IBB Daily Chart with Fibonacci Retracement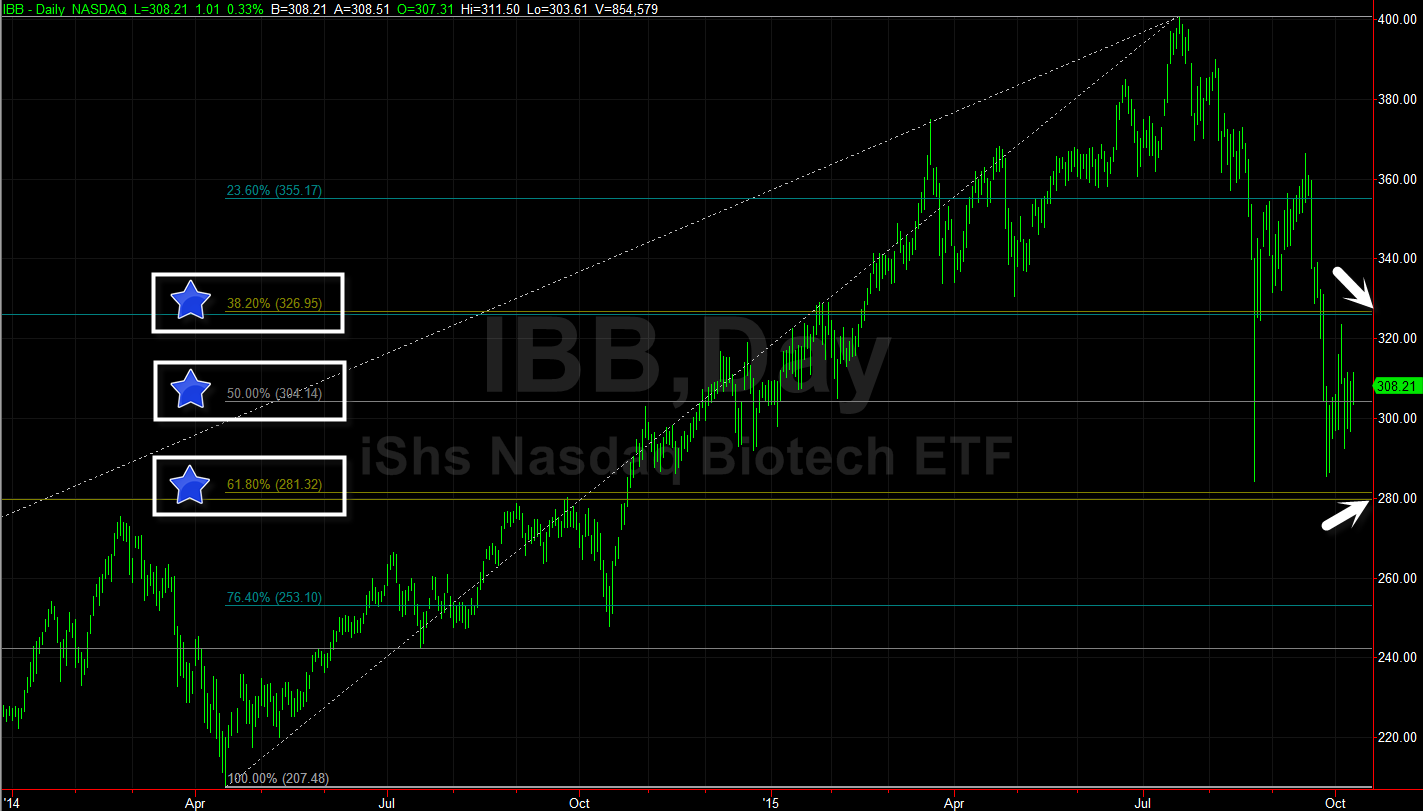
Where you place the key low and key high is vital when using Fibonacci Retracements on a trending security. In this case, we used the 2011 low, 2014 low, and 2015 high.
The big thing to note here are the Fibonacci levels on the Daily chart, especially that 2 overlap nearly perfectly with Fibonacci levels from the longer time frame. These areas have been key in the price action in recent months (280 low area, 325 high area, 300 50% Retracement mid-level area). This range should be important going forward in determining IBB price action.
There should be many good trading opportunities in the Biotech sector and among its ETFs going forward for the foreseeable future, in both directions.
by Moby Waller
co-Portfolio Manager, ETFTRADR
BigTrends.com
1-800-244-8736