Yes, Thursday's Rout Is a Bigger-Picture Problem
Not that bad days (even awful days) are unusual. Thursday's drubbing, however, is introducing a whole new kind of trouble for this already-wobbly market.
We've discussed several times in recent weeks how the market's recovery since October's low is encouraging, but not necessarily convincing. Namely, all the indices still had a couple of key technical resistance lines to clear before higher in a more meaningful way. Stocks were even dancing with some of those lines earlier this week, repeating tests first seen early in the month.
When they had to show their conviction the most though, the buyers flinched in a big way. Today's sharp selloff -- the biggest in three months -- didn't just undermine the rally effort. It also broke a handful of the key technical floors that were propping the market up and keeping the odds/hope of a more sustained rally alive.
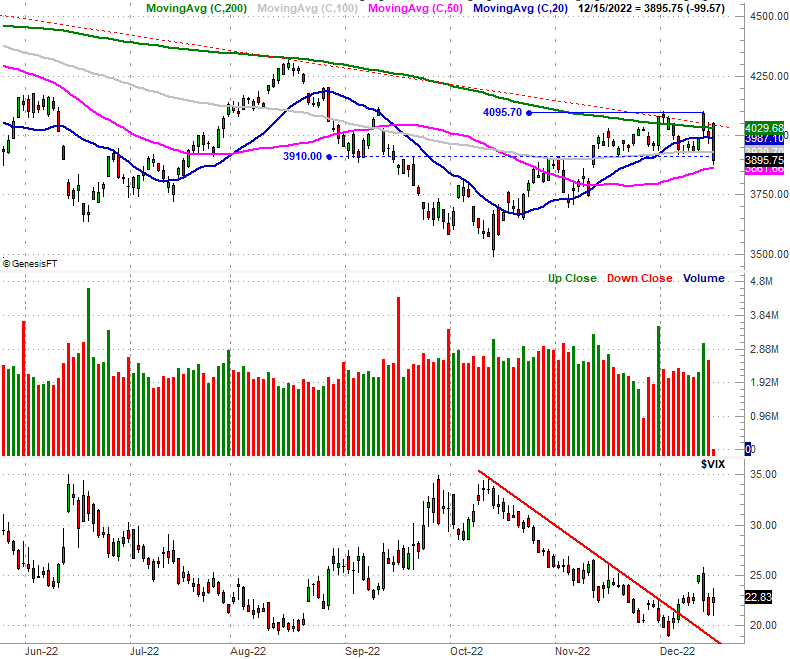
Take a look at the daily chart of the S&P 500 below to see what we mean. Thanks to the day's 2.5% selloff, the index is now under a key horizontal floor/ceiling at 3910, as well as below the 100-day moving average line (gray) at 3924. There's still a smidgen of hope given how the 50-day moving average line (purple) is still intact as technical support. The veracity and placement of the stumble is telling though. While it took several days to make it happen, in retrospect, it's the recent bump into technical resistance that started the plunge. The headlines and economic news were simply the excuse traders were waiting on.
The daily chart of the NASDAQ Composite looks similar, though more troubled. Like the S&P 500 it broke under several major support levels on Thursday. Unlike the S&P 500 though, the composite did pull all the way under its 50-day moving average line (purple) at 10,935. There are no other key technical floors left to rely on here.
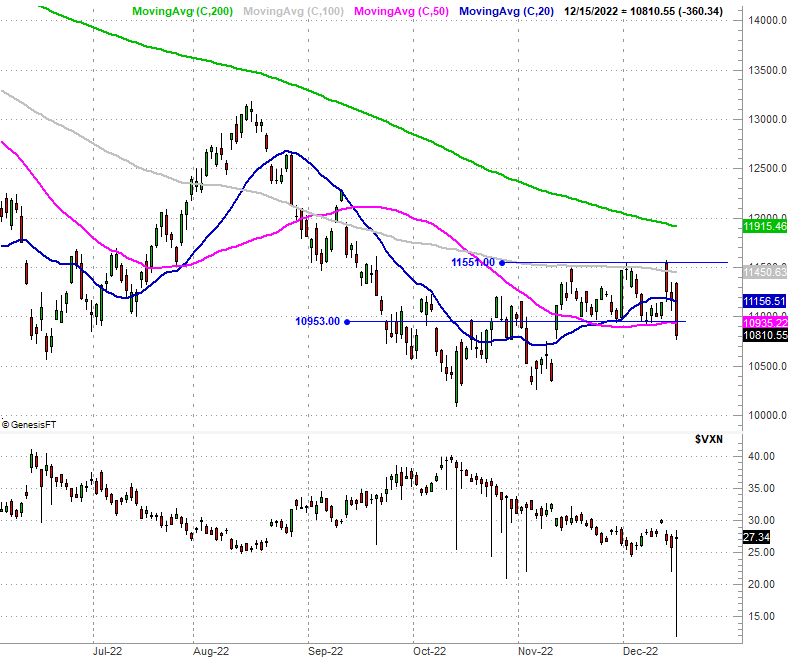
Perhaps most troubling of today's action, though, isn't what happened, but what didn't happen. What didn't happen is, the volatility indices didn't race higher. On the worst day for stocks in weeks, one would have expected both the VIX and VXN to surge. Their failure to do so suggests there's much more downside to go before a true capitulatory bottom is hit.
Don't misread the message. The selloff doesn't necessarily have to keep moving... on Friday, or into next week. Indeed, given the sheer size of Thursday's plunge, odds are good we'll see at least a little bullish relief on Friday (although the futures are down Thursday evening, heading into Friday's session). The bulls really exposed a major vulnerability though. Even a bounce on Friday doesn't mean the selling is done.
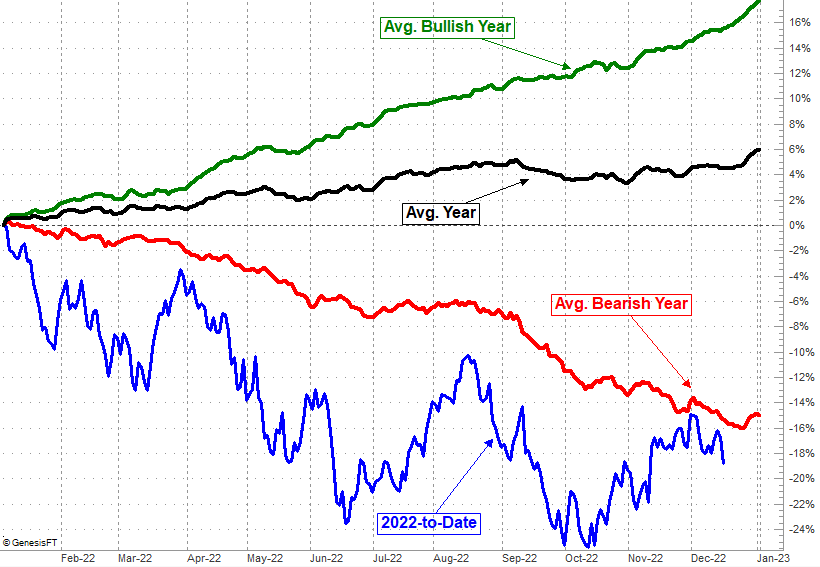
To this end, the recent action rekindles the likelihood that this year's action to-date looks a great deal like the average bearish year (a year in which the S&P 500 logs a loss). In "bad" years the S&P 500 tends to fall from early December to the very late part of December, with a modest Santa Claus rally offering a little but of relief at the very end of the month.
Bottom line? First and foremost, don't panic. Take a few deep breaths. We all innately knew something like this was possible, and we knew what it would look like if and when it did happen. That's all this is.
And, even if the selling isn't quite done yet, we may be nearer and end to the bear market than not. The average bear market lasts around 15 months. That would put this one's end sometime in March or April. The average bear market also drags the S&P 500 about 33% lower, so one more good sucker-punch should get the S&P 500 to that level at less... a sucker-punch that may have just started.
As always, keep close tabs on the market. This is still a day-by-day, in-flux affair.