-- Oil prices could dip if the commodity continues to struggle with resistance and fails to hold last month's low. Here's the chart. --
By Bret Kenwell, TheStreet.com
Oil prices have been volatile over the past 16 months or so. Remember when oil futures went into negative territory, way back in April 2020?
The world truly looked as if it had been turned upside down. That was a shot of volatility that few investors could have ever predicted.
The S&P 500 fell more than 30% in a month, while crude-oil prices were decimated.
Negating the negative dip, which was due to some future-contracts expiration, we saw prices evaporate in just a few weeks, with oil shedding more than 80% of its value.
That makes sense, though, as demand dried up and all that was left was a flood of supply. The world - and in particular, the oil market - isn't built for that type of disruption.
Now we're seeing the opposite: As demand for gasoline and oil booms higher, producers are scrambling to increase supply. In many cases, though, politics and optics are involved, as producers want higher prices per barrel to shore up their finances.
In any regard, what do the charts tell us about oil prices?
Trading Oil
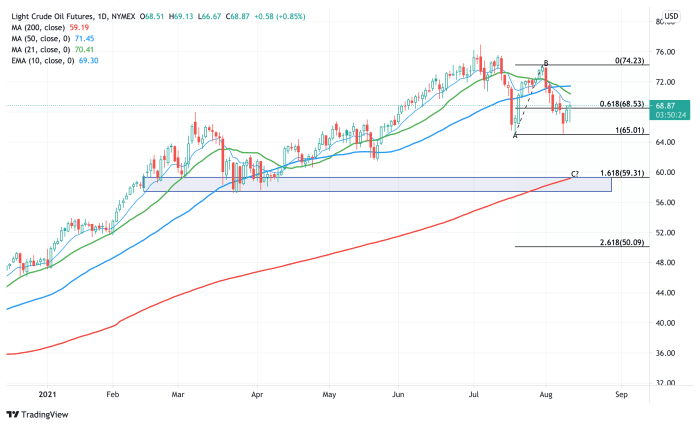
Daily chart of oil prices
Chart courtesy of TradingView.com
In March, oil prices surged to then year-to-date highs near $70 before pulling back and finding support between $57.50 and $60.
After firming up, they went on another run, this time topping out two pennies shy of $77.
At this week's low, oil prices bottomed near $65, which was last month's low.
Now, it's totally possible that the low is in - or close to being in - and that crude pushes higher and continues to recover.
If it does that, we first need to see it reclaim the 10-day and 21-day moving averages. Back above the 50-day moving average puts $74 in play, the high from August, followed by a potential push toward the 2021 highs near $77.
But the downside is where things get interesting.
Should crude continue to be pressured lower and close below the $65 level, we'll officially have a monthly-down rotation in play.
That opens the door to a possible "ABC" correction. In this scenario, that could land crude oil down around $60.
The 50-day moving average will come into play near that area, along with the 161.8% downside extension.
Remember, between $57.50 and $60 was support in the first and second quarters, so I would expect this area to buoy oil prices should they fall that far.
In any regard, that's how I'm looking at the scenario, with a keen focus on the $65 level.
From TheStreet.com