Weekly Market Outlook – Things Just Got Officially Ugly
Stocks started last week off on a bullish foot. But, the move wasn’t built to last. As the week wore on and a few too many earnings reports raised a few too many red flags, the market broker under a few too many more support levels. There’s little -- maybe nothing -- to latch onto now. The indices may have to go ahead and give us a full-blown correction before being able to rally again.
Yet, the bulls might have one chance to bring the market back from beyond the ledge they’re now slipping over.
We’ll look at that potential path to redemption in a moment. Let’s first work through last week’s biggest economic announcements.
Economic Data Analysis
While it was a busy week on the economic front, we won’t be charting most of it. There’s still plenty to discuss though.
Case in point: Last quarter’s GDP growth rate. Economic growth perked up, accelerating from Q2’s clip of 2.1% to 4.9%, versus expectations of only 4.7%. Just keep in mind the baseline comparison is rather low. This doesn’t inherently mean the economy is firing on all cylinders. Most economists still expect GDP growth to slow to a crawl again in 2024.
Consumerism is pretty robust as well, although people are being paid a bit better to support thins spending. Personal income growth was down a bit from August’s level in September, while personal expenditures jumped more than expected from August’s growth pace. The end result is net inflation that’s in line with recent norms, giving the Federal Reserve reason and some room to dish out one more rate hike this year. (This number from the Bureau of Economic Analysis is the one the FOMC reportedly pays more attention to.)
As for numbers we’re going to chart, let’s start with Wednesday’s new home sales report. You may recall sales of existing homes were particularly weak in September, falling to multi-year low levels. Once again, sales of newly-built homes took up some of that slack linked to a lack of inventory (despite higher mortgage rates). New home sales grew to an annualized pace of 759,000 last month… a multi-month high.
New, Existing Home Sales Charts
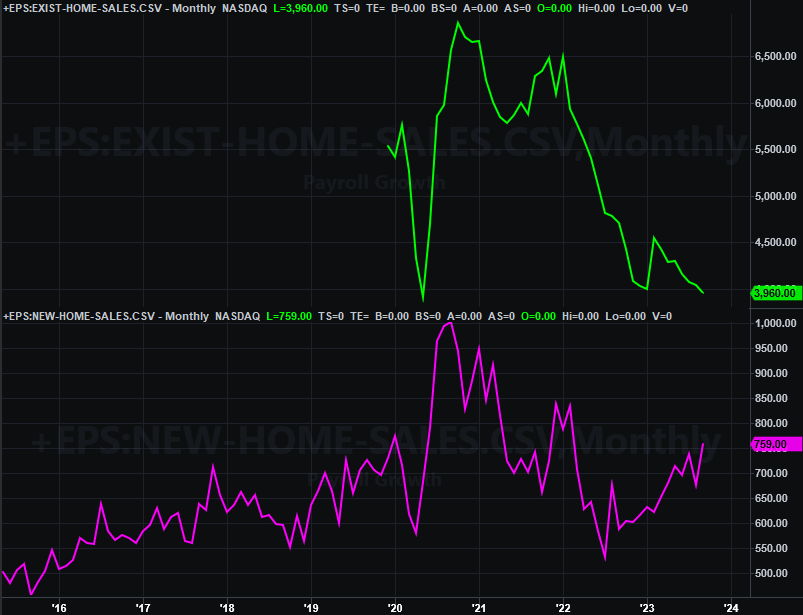
Source: National Association of Realtors, Census Bureau, TradeStation
Just bear in mind that in a normal environment, new home sales only account for about one-tenth of all homes sales in the United States.
The only other item from last week we’re charting is October’s third and final look at the University of Michigan Sentiment. As was expected, it tumbled. One month doesn’t make or break a trend, but this is not the direction we want to see this data headed at this stage of the nascent rebound.
Consumer Sentiment Charts
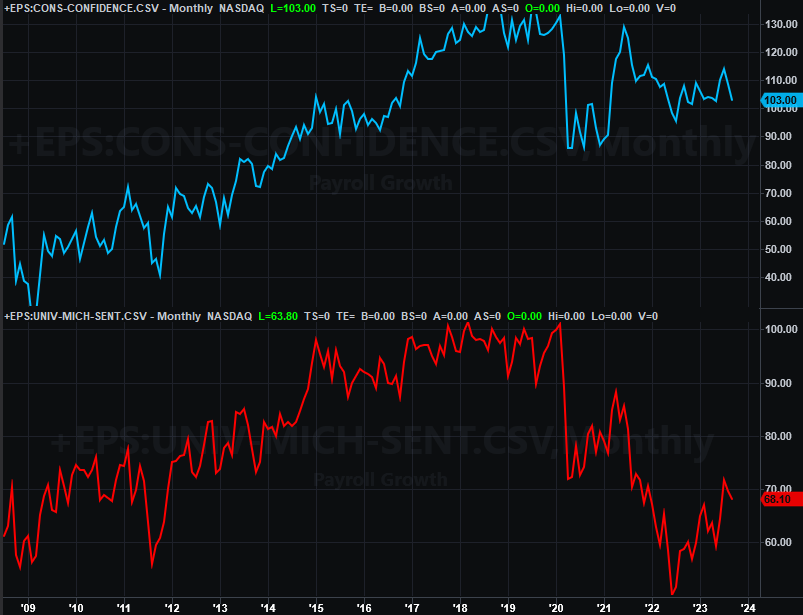
Source: Standard & Poor’s, FHFA, TradeStation
The Conference Board’s look at consumer confidence will be posted on Tuesday of this week. Forecasters believe it fell as well, reaching a new multi-month low of 100.
Everything else is on the grid.
Economic Calendar
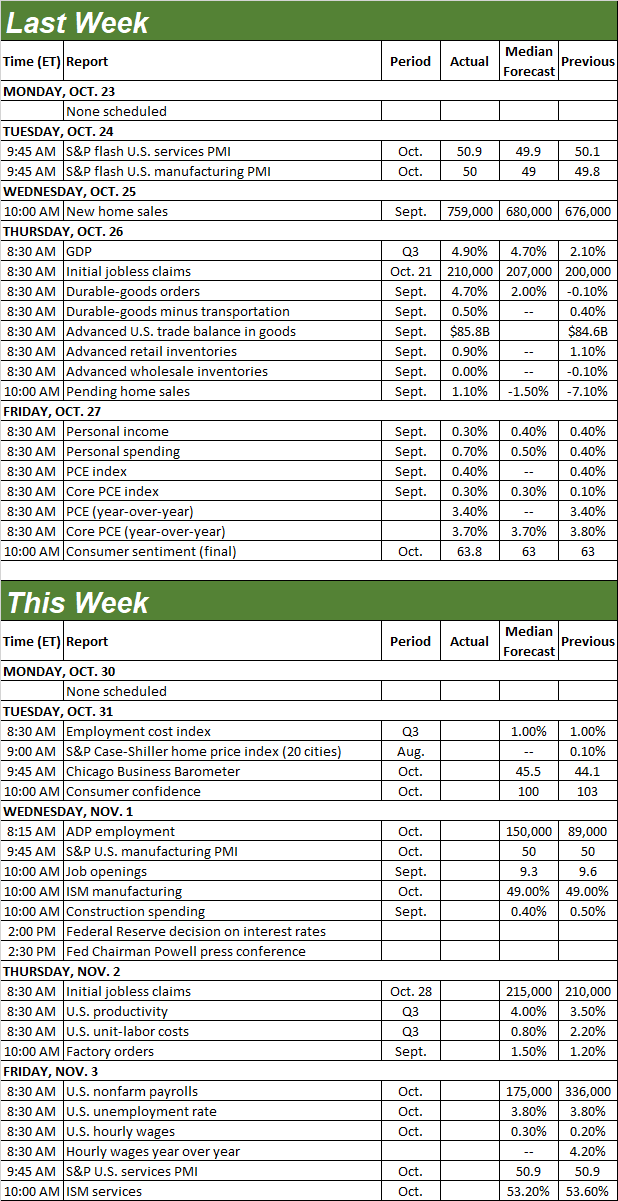
Source: Briefing.com
This week will be another busy one aside from Tuesday’s update on consumers’ moods. The Institutie of Supply Management will post its update on its manufacturing index on Wednesday, followed by the release of October’s ISM Services Index on Friday. Both should more or less be in line with September’s levels. Clearly manufacturing is in a bigger-picture recovery, although services activity seems to be stalling.
ISM Services, Manufacturing Index Charts
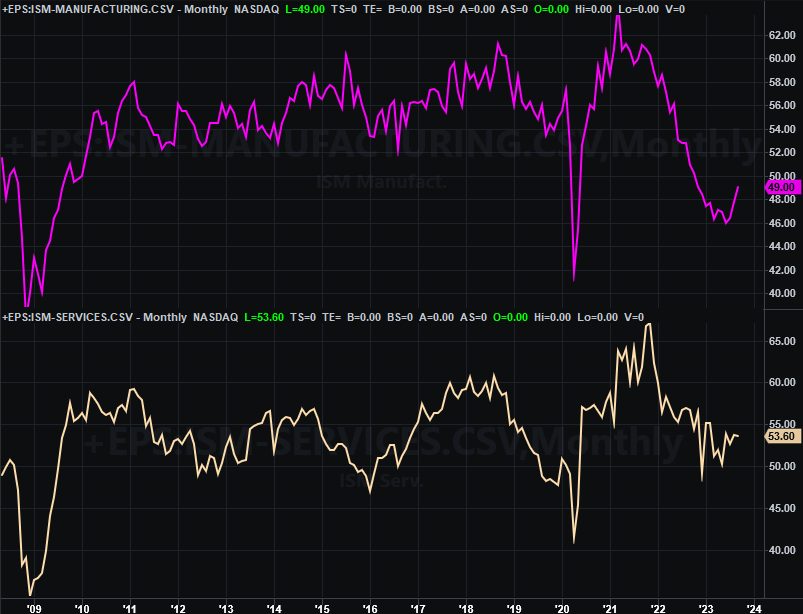
Source: Institute of Supply Management, TradeStation
Friday’s biggie, of course, will be October’s jobs report from the Bureau of Labor Statistics. It’s not likely the United States will match September’s job growth of 336,000. The 175,000 new nonfarm jobs economists do think we added, however, should be enough to hold the unemployment rate down to its current level of 3.8%.
Unemployment Rate, Payroll Growth Charts
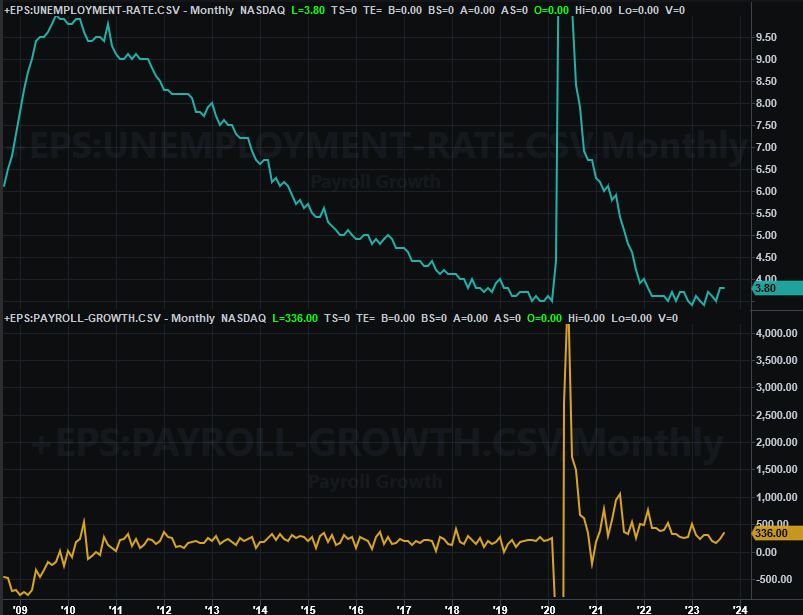
Source: Bureau of Labor Statistics, TradeStation
Stock Market Index Analysis
Last week wasn’t just another tough one for the market. It dished out a major technical blow. The S&P 500 was already under its 200-day moving average line. The NASDAQ Composite followed suit last week. In so doing, there’s no real meaningful support level left to stave off any further selling. Take a look.
NASDAQ Composite Daily Chart, with VXN and Volume
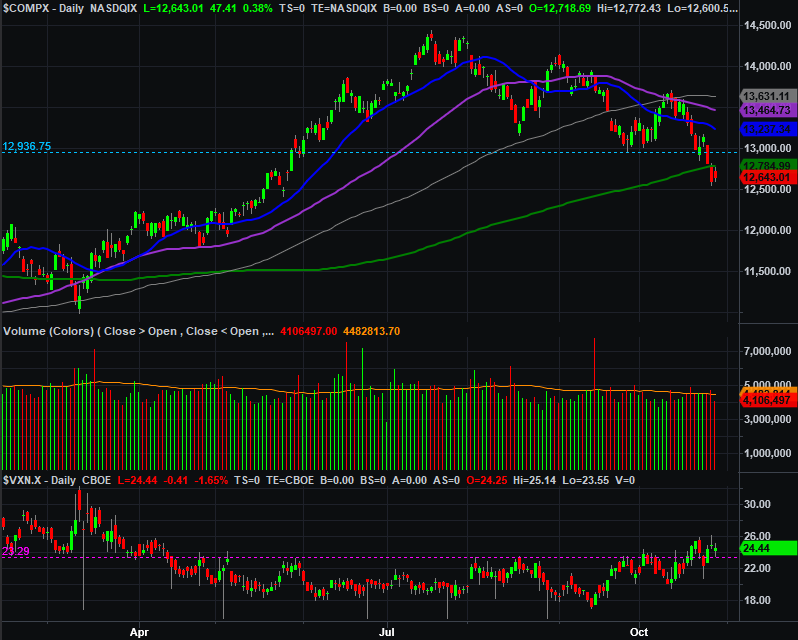
Source: TradeNavigator
The composite also broke under its 38.2% Fibonacci retracement level at 12,746 we talked about on Wednesday of this past week (when this line was only being tested as a floor). With it now broken, again, there’s little left that will keep the NASDAQ propped up. Also notice the rising support line dashed) that had been steering the index higher from December’s low is decidedly breached now on the weekly chart of the NASDAQ Composite.
NASDAQ Composite Weekly Chart, with VXN and Volume
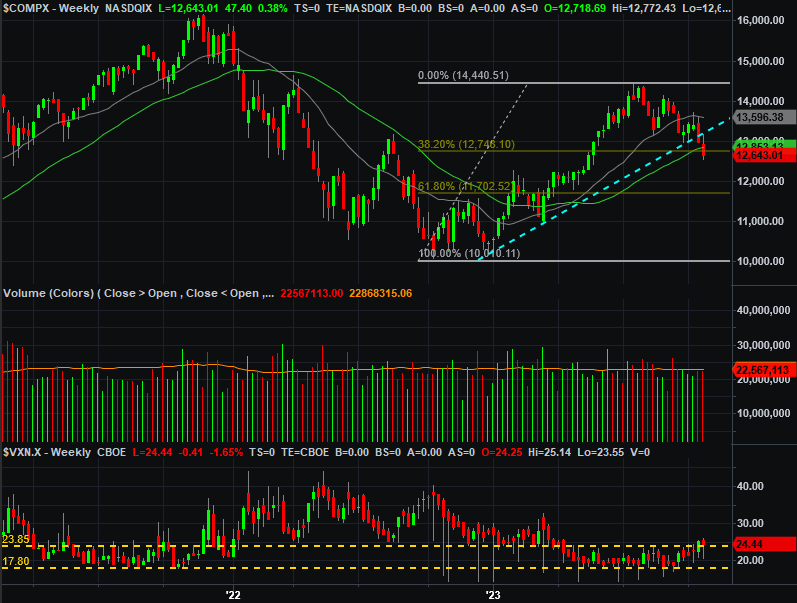
Source: TradeNavigator
Perhaps more concerning than anything, though, is the fact that the NASDAQ’s Volatility Index (VXN) remains above its recent resistance level around 23.4. This underscores the market’s turn for the worst, suggesting traders are starting to position-for and hedge-against a more serious selloff. The market won’t likely hit bottom until the VXN soars to a clear, pointy spike.
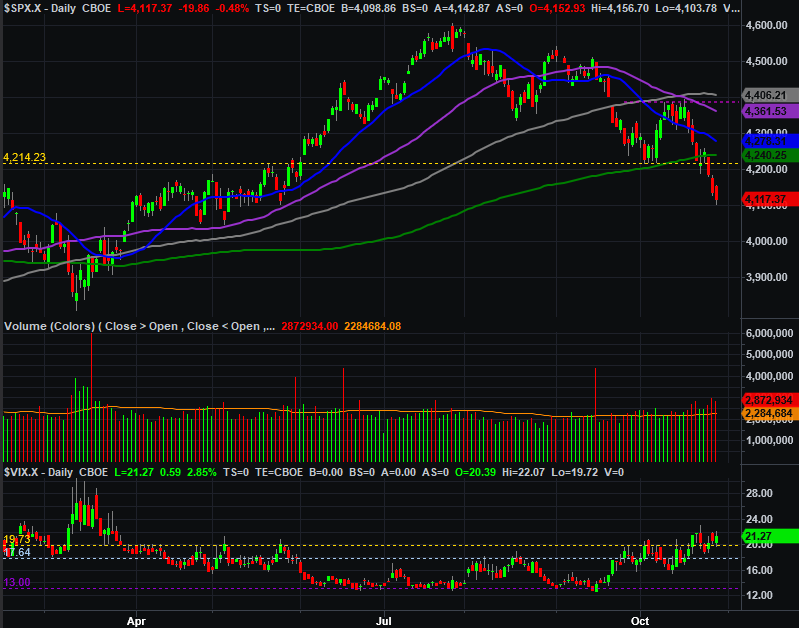
The same goes for the S&P 500’s Volatility Index (VIX). It fought its way above its technical ceiling at 19.7 a week ago, and is holding the line as the S&P 500 itself continues to break down. Also note the S&P 500 is below a key horizontal floor at 4,214 (yellow, dashed) as well as well under its 200-day moving average line (green) at 4240… red flags that weren’t yet waving a week ago. Notice as well that the volume behind the selling is growing. More and more would-be sellers are getting off the sidelines.
S&P 500 Daily Chart, with VIX and Volume
Source: TradeNavigator
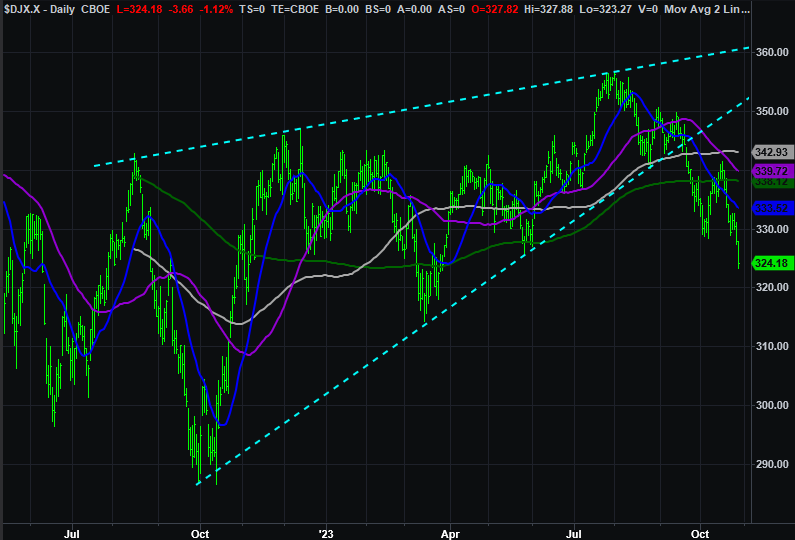
The Dow Jones Industrial Average, by the way, is breaking down as well.
This is a pretty curious development. For the better part of the past several months we’ve seen the Dow generally perform better -- or at least less bad -- at the expense of more aggressive, less-blue-chippy stocks (and vice versa). That’s not the case now, however. All stocks are struggling including the stalwart Dow names that would normally be defensive plays traders seek out when they were scared to hold other kinds of tickers. Note the started to struggle once it broke under the lower boundary of the converging wedge pattern (framed by dashed lines) going back to last August’s high.
Dow Jones Industrial Average Daily Chart
Source: TradeNavigator
Ironically, the best (and maybe only) thing working in the market’s favor right now is the sheer scope and distance of the pullback suffered over the course of the past couple of weeks, and the past three months. The S&P 500 is down more than 5% for the past two weeks, pulling it more than 10% below July’s peak. That’s technically enough to qualify as a full-blown correction, setting the stage for a bounce.
The only problem is the timing of it all. Calendar-based trends suggest this weakness should persist until mid-November.
If we end up seeing this selloff continue to that point, that’s arguably a huge buying opportunity. Don’t be surprised to see the VIX and VXN reaching multi-month highs at the time, commensurate with a major market bottom.
As always though, first things first.