Weekly Market Outlook - The Whole "Two Steps Forward, One Step Back" Thing

The selling was anything but brutal, but the bears held the lines they absolutely had to hold of they wanted to keep this rally from starting its next bullish leg.
The bulls still have a chance, mind you... a good chance. Indeed, both of the key indices are holding above all the major support levels we referenced last week. Things could still go either way. That's the point though - things could still go either way. Fortunately we've got some crystal clear make-or-break levels to keep tabs on.
We'll look at them below, as we always do. We'll first look at last week's and preview this week's economic reports, however, to paint the bigger picture with some broad brush strokes.
Economic Data Analysis
A bunch of data was thrown at us last week. Let's just dig in, in order of appearance. That would put new homes sales numbers for June at the top of the list. The tumbled to a pace of 676,000, from the downward-revised figure of 724,000 for May. You may recall from a week ago that sales of existing homes ticked a little higher in June, but only a little... and its bigger trend also shows a clear deceleration.
New, Existing Home Sales Charts
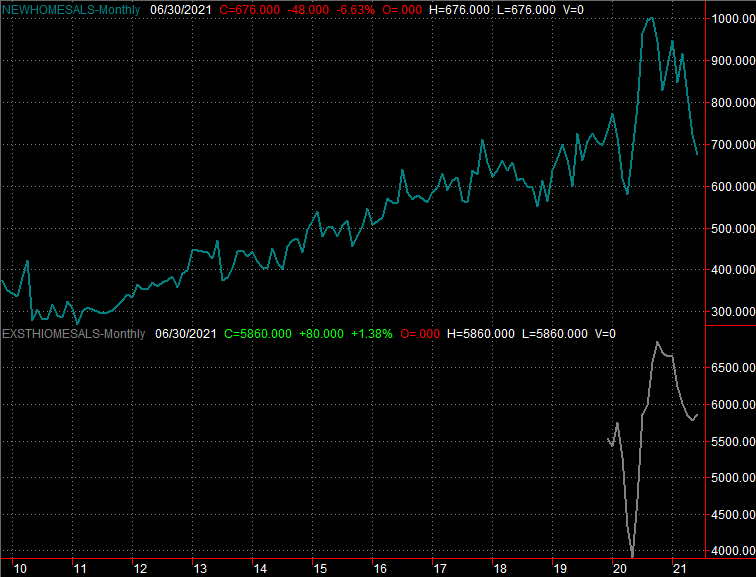
Source: National Association of Realtors, Census Bureau, TradeStation
There are multiple reasons for this headwind, ranging from costly lumber to the fact that anybody who wanted to buy a house has likely already done so within the past year, taking advantage of very low interest rates. Inventory levels are improving, but remain below long-term norms.
This is a bit troubling... or would be were it not for the other batch of real estate data served up last week. Home prices (of homes sold) continue to move deeper into record-high territory. The Case-Shiller Index says homes cost 17% more than they did a year ago, while the FHFA reports home prices improved 1.7% from a month earlier. That's May's numbers - not June's - so there may be a delay factor. Or, maybe not. Home sales have been slowing for several months now, and it hasn't crimped prices yet.
Home Price Charts
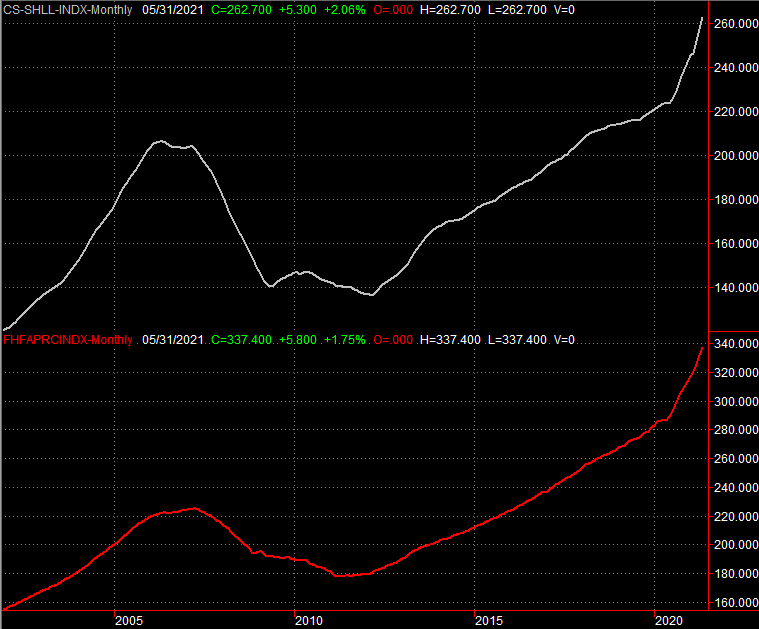
Source: FHFA, Standard & Poor's, TradeStation
Of course, nothing forces the end of a rally and the beginning of a meltdown like excessively frothy prices.
It was a big week for sentiment reports too, and a mixed one. The Conference Board's consumer confidence levels surprised forecasters by not peeling back from June's multi-month peak, but instead inching even a little higher. The University of Michigan sentiment measure, however, renewed its pullback that first started to take shape a couple months back.
Consumer Sentiment Charts
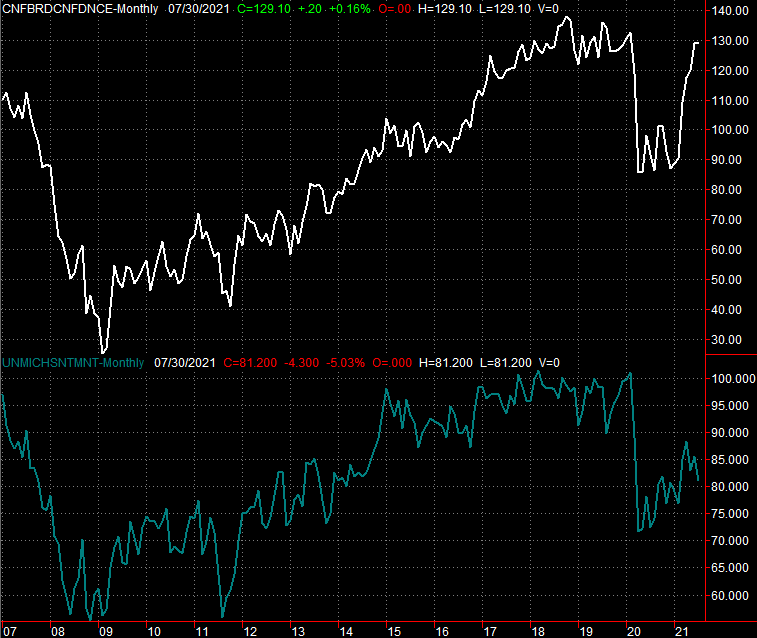
Source: Conference Board, University of Michigan, TradeStation
Other numbers posted last week that aren't worth charting include the first estimate of Q2's GDP growth rate. It was disappointing, coming on at 6.5% versus expectations of 8.5% and Q1's final reading of 6.3%. Still, the economy remains strong enough (and inflation isn't yet enough of a threat) that the FOMC saw no reason to push interest rates higher. That discussion, though, is happening more and more earnestly. Everything else is on the grid.
Economic Calendar
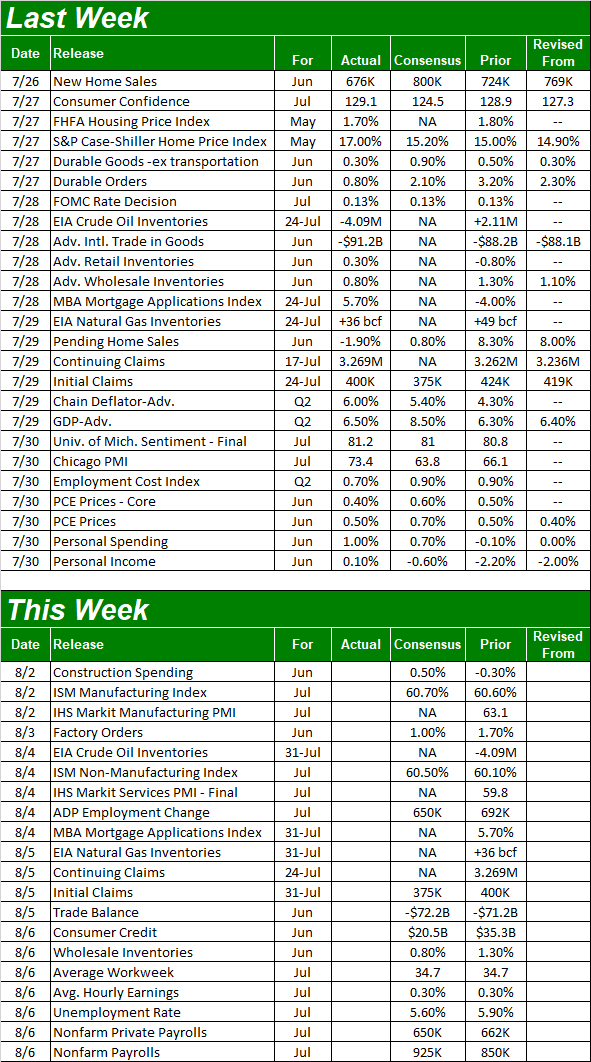
Source: Briefing.com
This week's a whopper.
On Wednesday we'll hear ISM's manufacturing index update, followed by Thursday's services index report. Economists believe July's scores will look pretty much like June's, which is great, since June's levels are both well above the pivotal level.
ISM Services and Manufacturing Charts
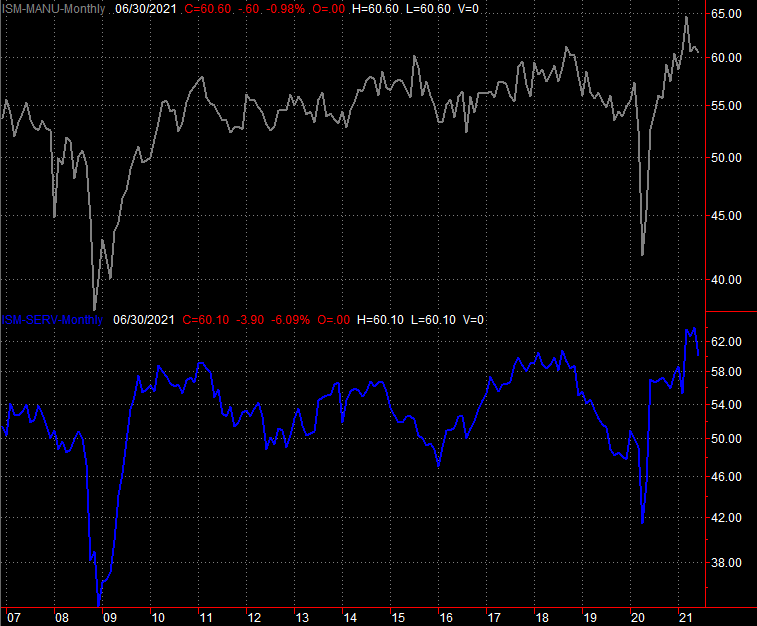
Source: Institute of Supply Management, TradeStation
On Friday look for July's jobs report. It's a critical one. Forecasters believe we added 925,000 new jobs (or recovered that many jobs), which should be enough to drive the unemployment rate down from 5.9% to 5.6%. Just remember that a month ago, while payroll growth exceeded expectations, the unemployment rate rose rather than contracted. It's got to do with the way the number is calculated, though it's problematic all the same... and would be again if it happened again.
Payroll Growth and Unemployment Rate Charts
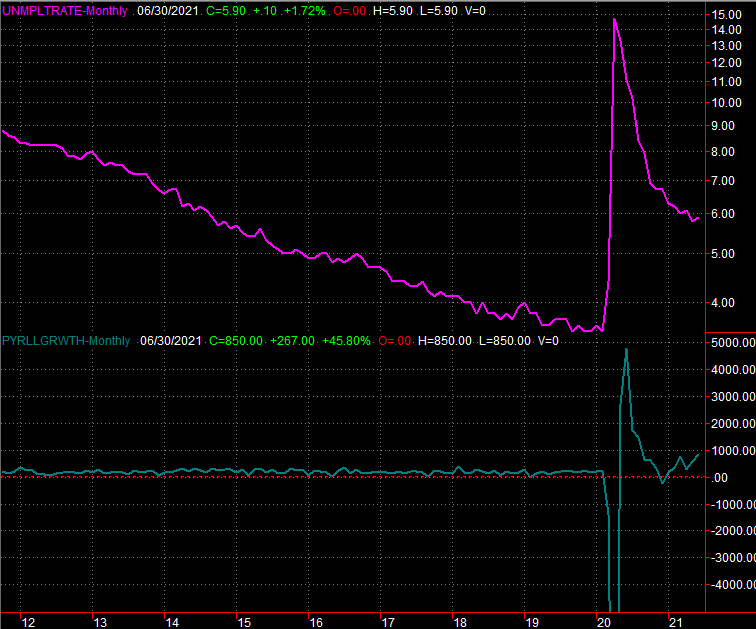
Source: Department of Labor, TradeStation
Stock Market Index Analysis
The big news this week isn't news at all. It's the same story as the week before, the week before that, and for that matter, the week before that. Stocks are stuck in a modestly bullish trading channel, with the S&P 500 testing its upper boundary (orange) again last week without actually clearing it. Take a look.
S&P 500 Daily Chart, with VIX and Volume
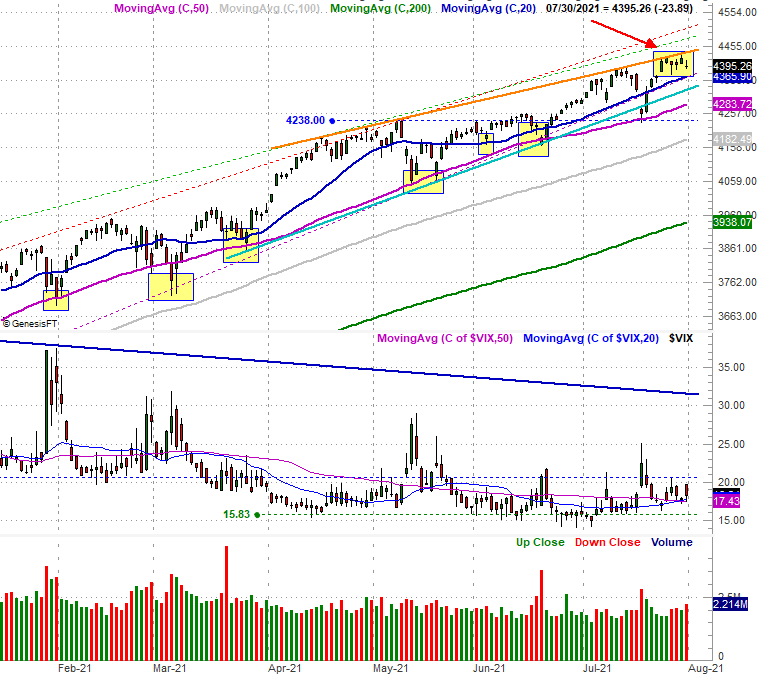
Source: TradeNavigator
That's not a bad thing. The rising resistance line is... well, rising. And, the S&P 500 is clearly unwilling to move below any of its key support levels.
The red flags are (still) waving though. Namely, the VIX is testing the waters of a more measurable move upward that could coincide with a more pronounced pullback. The ceiling at 20.6 (blue, dashed) is being tested in particular, and to the extent it matters the VIX also seems to be finding support at its converged 20-day and 50-day moving average lines at 17.4. Maybe it's something. Maybe not. Also take note of the fact that while the market held onto early gains for the full week, the "down" days - Tuesday, Wednesday, and Friday - were on higher volume than the recent bullish days. That's something we've seen a lot of lately, in fact.
Here's the weekly chart of the S&P 500. From this perspective we can see just how narrow the bullish trading range really is. The narrow the alley, the more probable a volatile move will break out of it.
S&P 500 Weekly Chart, with VIX and Volume
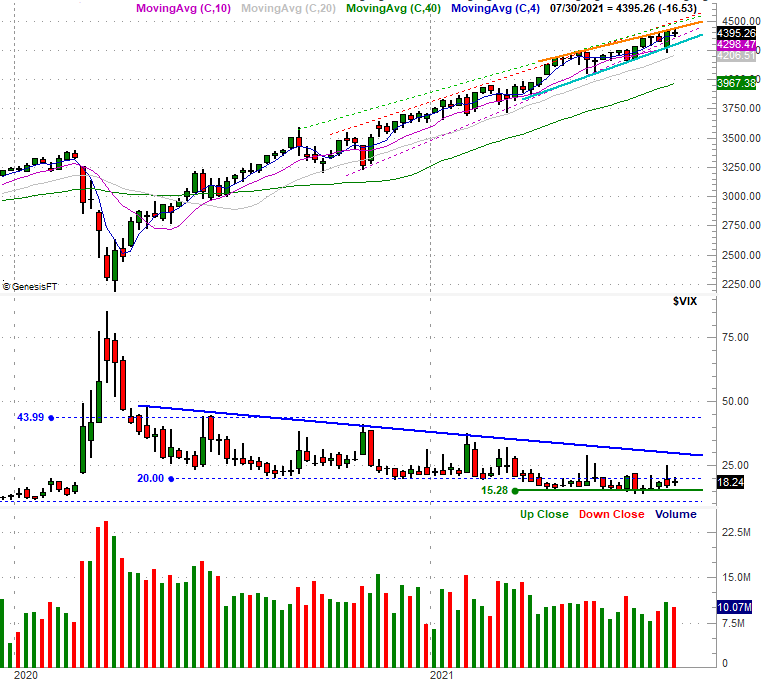
Source: TradeNavigator
The NASDAQ Composite also remains in bullish mode, though with a less-guided direction. It's just coming off a touch of record highs, and like the S&P 500, remains above almost all of the technical floors it should be above.
NASDAQ Composite Daily Chart, with VXN
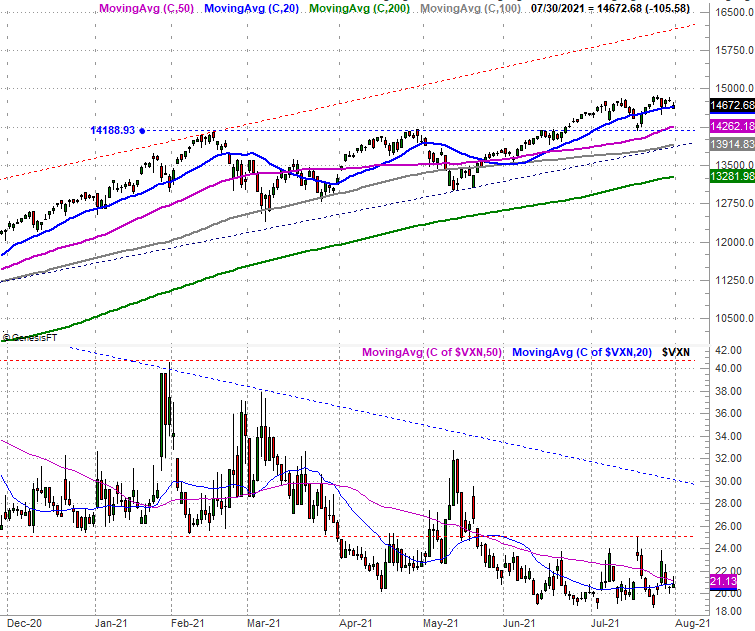
Source: TradeNavigator
And the weekly chart.... though not much changes with this view. The weekly chart does, however, hash out the NASDAQ Volatility Index's (VXN) key lines in the same. The horizontal line at 24.9 continues to be tested, but perhaps more important now, the falling resistance level that's connected all the key highs since September (and currently at 29.6) is within sight. The composite would still have to plunge below a thick band of support between 13,395 and 14,330 for any upward thrust from the VXN to really mean something. But, it's something to put on the radar.
NASDAQ Composite Weekly Chart, with VXN
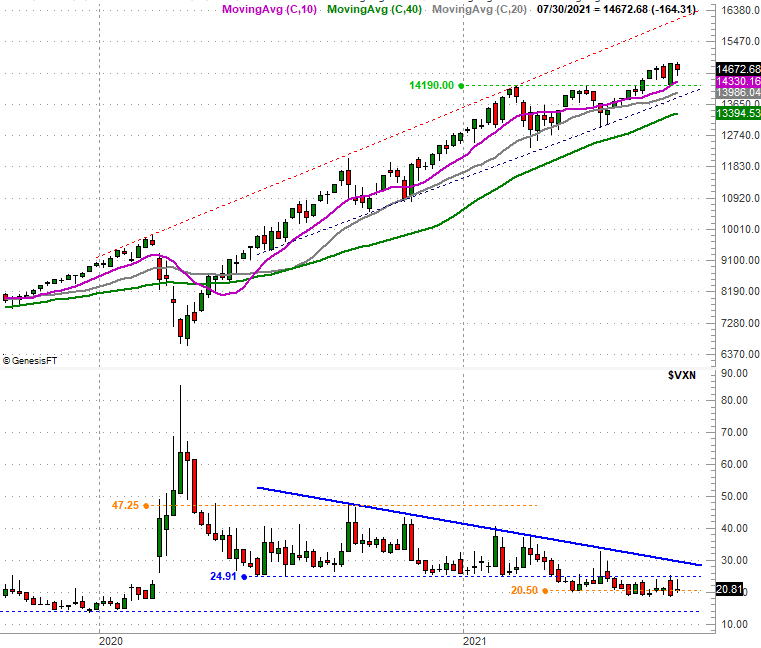
Source: TradeNavigator
There's still a risk, to be clear. This year's gain thus far is still well ahead of the norm.... even when excluding bearish years. Indeed, it's inevitable we'll pay this piper sometime. October still appears to be the move vulnerable month.
S&P 500 Year-to-Date Performance vs. Averages
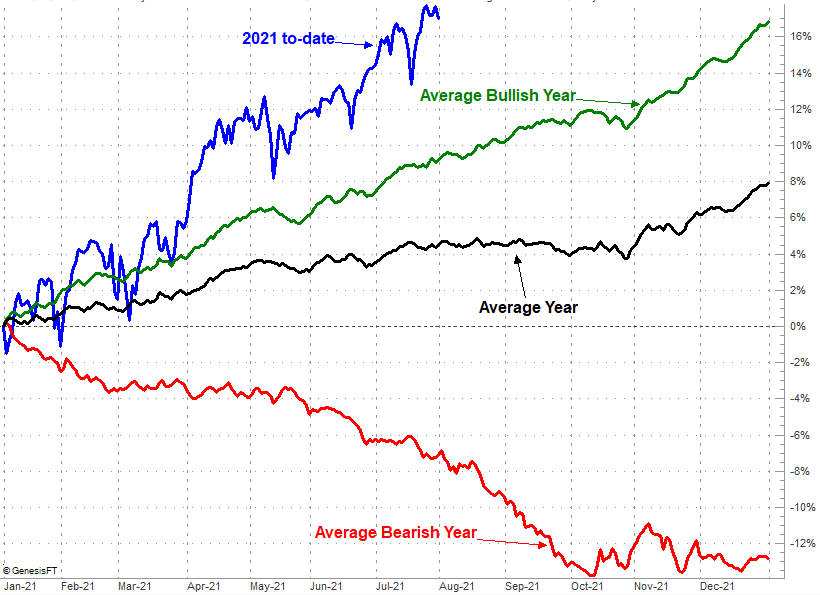
Source: TradeNavigator
In this environment, however, nobody can afford to be presumptuous. Follow the trend until it's clear you can't follow it any longer. The trend is still bullish, and most of the indices continue to find clear support at their most important technical floors.