Weekly Market Outlook - The Trump Bump Can't Get Over the Hump
Weekly Market Outlook - December 18th, 2016
Despite a couple of tries, the bulls could never quite achieve escape velocity last week, perhaps a bit stunned and a little concerned not about the rate hike (that was pretty much a foregone conclusion), but by the fact that the Fed's current plans include not two but three more rate increases in 2017. It's more of a perception issue than an economic one, but perception is everything with traders have pushed stocks up to a P/E near 22 on hopes that explosive earnings growth is around the corner.
We'll dissect the market's action below -- as always -- but first let's run down last week's and this week's economic reports. There were some biggies last week, and there are a couple of biggies in the lineup.
Economic Data
There's no need for any pretense that anything else matters as much as last week's rate hike from the Federal Reserve. As expected, Janet Yellen and Co. have bumped their target Fed funds rate up from a range of 0.25% to 0.50% to a range of between 0.5% and 0.75%. The economy is strong enough to handle it. That's not the interesting part of the story though. What's interesting is that the Fed foresees three rate hikes in 2017, after only two in the past ten years (the second of which was last week's).
Fed Funds Rate "Dot Plot" Outlook Chart
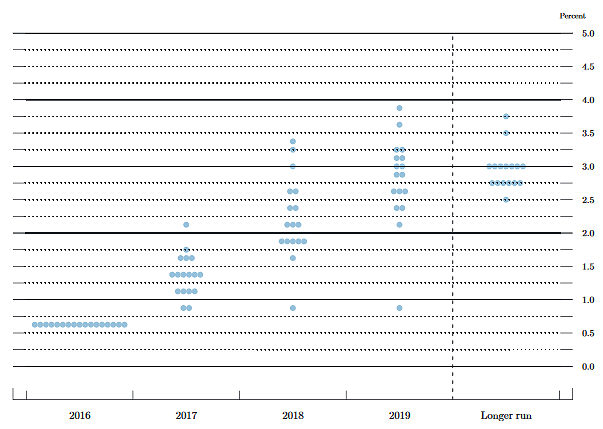
Source: FederalReserve.gov
Bear in mind that these outlooks can and often do change. If the economy isn't thriving, the FOMC can and will scale back its rate-hike intentions.
Appropriately, we also heard last month's inflation rates last week... producer and consumer. Both continued to march forward, or hold steady at target levels. The rise isn't at breakneck speeds, but it's methodical and needs to be dealt with. One rate hike may not slow it down.
Year-Over-Year Inflation Rate Charts

Source: Thomson Reuters
It was also a key weak for retail sales. For the month, retail sales were reported to only be up 0.1% with cars, and 0.2% without automobiles in the equation. That was below expectations, and considered weak. There's more to the story though. Last month's spending levels were more than 3% better than November-2015's consumer spending, indicating strength and confidence that wasn't measurable in the more touted numbers.
Retail Spending Growth, Year-Over-Year Charts
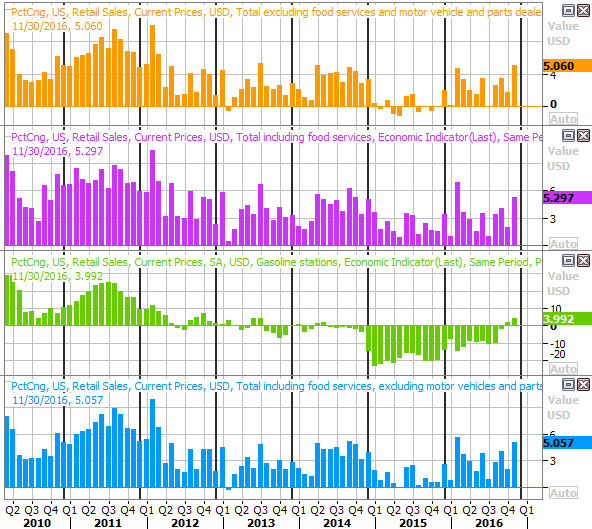
Source: Thomson Reuters
Most retail stocks were hit rather hard late last week on concerns that holiday shopping wasn't going well. We'll see next month.
Finally (and concerning), November's capacity utilization and industrial productivity waned just a bit. This is a bit of a red flag because this data is highly correlated with the market's long-term direction. While confidence soared on the prospect of a Trump presidency, businesses didn't see a bump. Granted, it may take more than one month for a President-elect's policy plans to trickle down to factory floors, but this isn't a sign that the Trump economy is going to hit the ground running come January.
Capacity Utilization and Industrial Productivity Charts
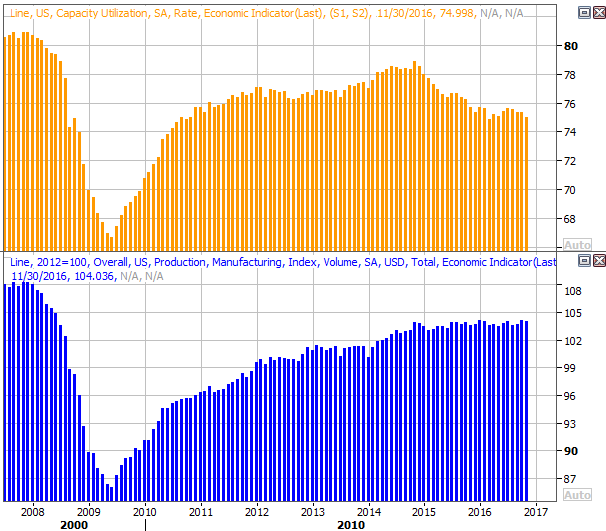
Source: Thomson Reuters
We could use some help here, and soon.
Everything else is on the grid.
Economic Calendar
Source: Briefing.com
This week isn't going to be quite as busy, but there are a couple of items we want to watch closely.
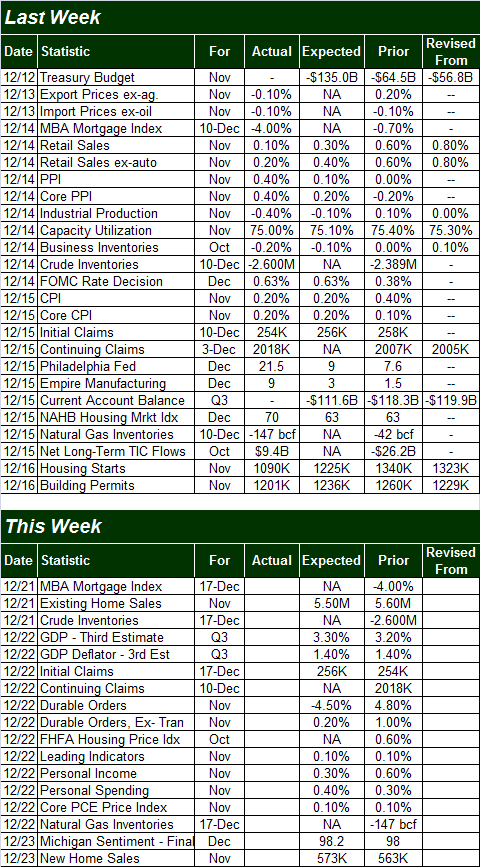
One of them is home sales... new home sales, and existing home sales. The former will be reported on Wednesday, and the latter will be posted on Friday. We're seeing a pretty bullish trend here, though last month's decided dip in the pace of housing starts may mean we need to look for a headwind here too on the sales front.
New and Existing Home Sales, Inventory Charts
Source: Thomson Reuters
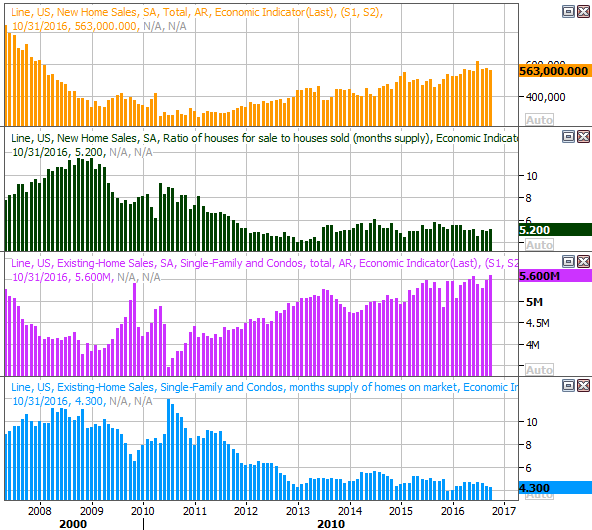
We're also going to get the third and final reading for Q3's GDP growth rate on Thursday. The pros aren't looking for a huge change from the second estimate... from the second guess of 3.2% to 3.3% now. Either is an encouraging measure.
GDP Growth Chart
Source: Thomson Reuters
Index Analysis
The market isn't technically in trouble yet, but it's close.
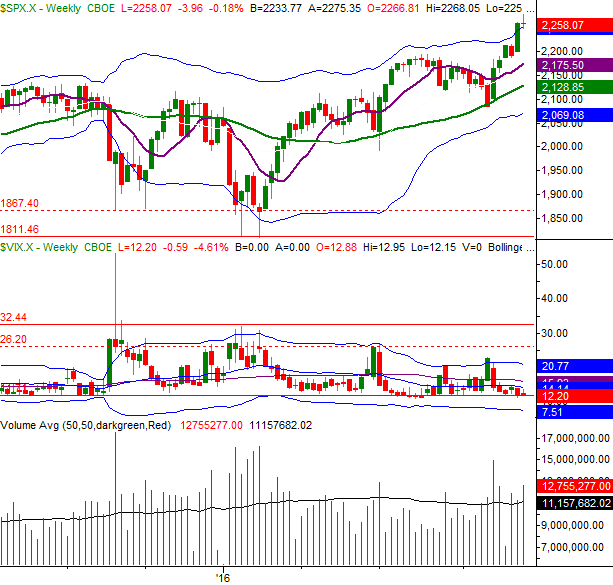
Take a look at the daily chart of the S&P 500. The bulls tried to forge ahead, but to no avail. By the time the closing bell rang for the day and the week, traders were looking south again. We're close to a bearish MACD divergence, and the PercentR line is inching towards a move back under the 80 threshold. The S&P 500 itself is toying with a key lower low; 2248 is the key. That's where the index hit a low last week. It's pretty clear the weight of the 8.3% gain since early November has become a problem.
S&P 500 Daily Chart
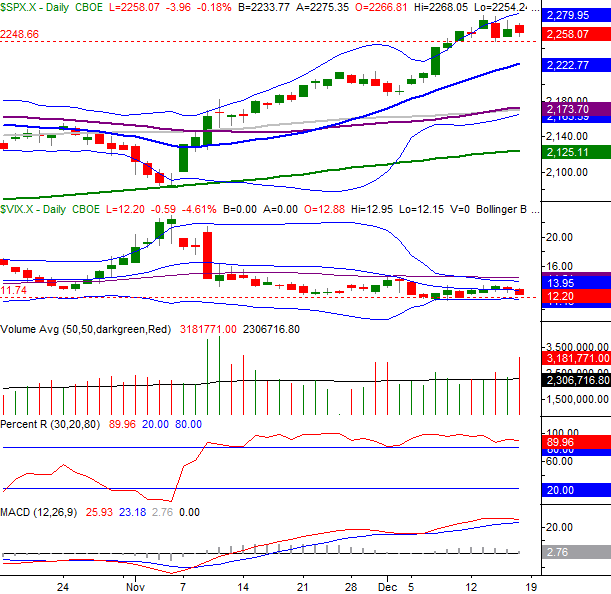
Chart created with TradeStation
To that end, zooming out to a weekly chart of the S&P 500 puts things in a little more perspective. Namely, in this timeframe we can see last week's bar was a doji bar (where the open and close are essentially the same, and materialize in the middle of the high-low range), and it took shape right above the upper 26-week Bollinger band. We mentioned last week how unusual - as in it's not happened in years - for the index to break this far above its upper Bollinger band line. This may be the ultimate setup for a pivot out of an uptrend and into a downtrend.
S&P 500 Weekly Chart
Chart created with TradeStation
And yes, the VIX is back to absolute levels. The fact that Friday was a triple-witching expiration day may have had something to do with it, but even before then the VIX was knocking on the door of unusually low lows that don't leave a lot of room for upside for stocks.
As of last week's close, the S&P 500's trailing P/E is a fairly frothy 22.2 and a forward-looking P/E of 17.8. Both are above their respective norms. To some degree the market can anticipate earnings coming in above expectations, but any reasonable degree of excess earnings potential has likely been priced in, and then some. That's apt to work against stocks.
Working for stocks is the calendar.
The month of December is usually a good one, with the S&P 500 averaging a gain of 1.5% gain for the month. And, the week between Christmas and New Years Day is also habitually a winner, reaping a gain of 1.0% (and advancing 76% of the time). Yes, the bulk of the usual December rally happens in the last week of the month. This time around though, the market is facing the disadvantage of going into the last week of the year in an overbought condition.
Maybe it will "reset" this week, and dish out a Santa Claus rally next week. But, if the sellers really dig in here (and do the unusual), this may be one year we don't get a Santa Claus rally. Just keep tabs on the moving average lines this week and next week to gauge how traders are feeling. Anything could still happen here, but the market's saying it doesn't have any clue as to what that might be.