Weekly Market Outlook - The Rally Hits an (Unsurprising) Wall

The four-week streak of gains finally came to a close last week, with the S&P 500 sliding 1.2% after making a multi-month high on Tuesday. And, given Friday's sharp selloff, we're starting the new trading week on the defensive. We're also moving into a time of year that's typically bearish anyway, with the disadvantage of a 17% runup from June's lows; there's pent-up profit-taking to be done here. Perhaps worst of all, the rally was stopped cold at a major technical ceiling. Connect the dots. This stumble could have been predicted, and is likely to grow legs.
We'll look at the action and implications below. First though, let's run through last week's key economic reports and preview what's in the pipeline for this week.
Economic Data Analysis
Last week's economic reports painted a mixed picture.
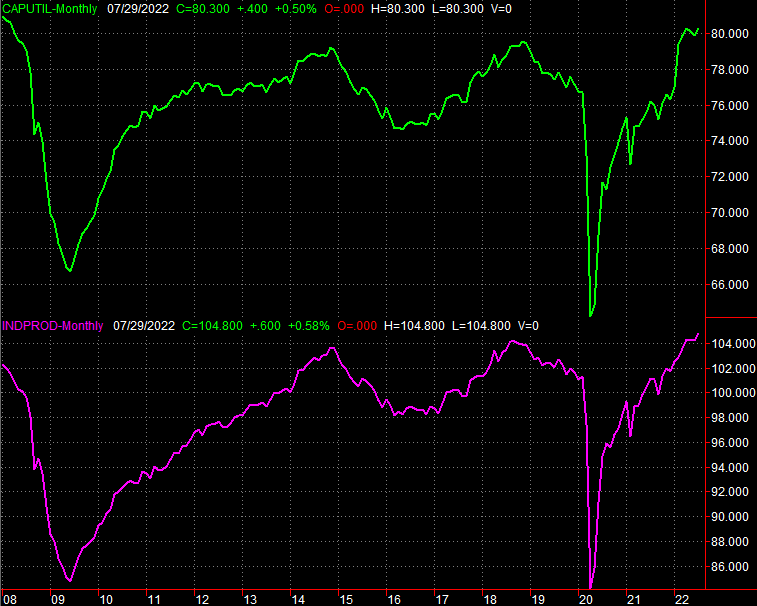
One bright spot is last week's capacity utilization and industrial productivity. The utilization of the country's manufacturing capacity edged a little higher last month, back to a multi-month high of 80.3%. Meanwhile, production also ticked a little higher, reaching a record of its own.
Capacity Utilization and Industrial Production Charts
Source: Federal Reserve, TradeStation
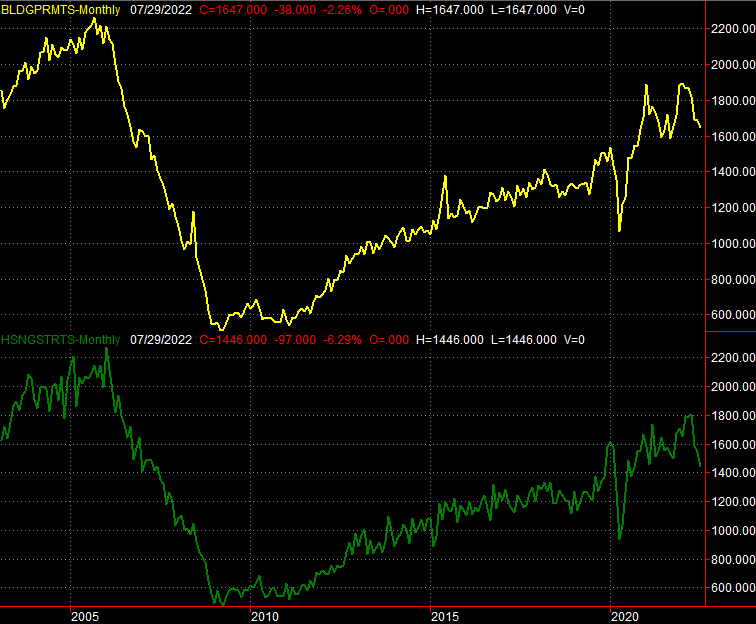
One sore spot, conversely, is July's housing starts and building permits... or starts anyway. Permits of 1.674 million was more or less in line with June's reading of 1.696 million. Starts, however, fell from June's 1.543 million to 1.446 million... the lowest level since the latter half of 2020, when the echoes of COVID-19's arrival in the United States were just starting to ring in earnest. The report confirms homebuilders' stance that housing as already in a recession, even if the economy isn't.
Housing Starts and Building Permits Charts
Source: U.S. Census Bureau, TradeStation
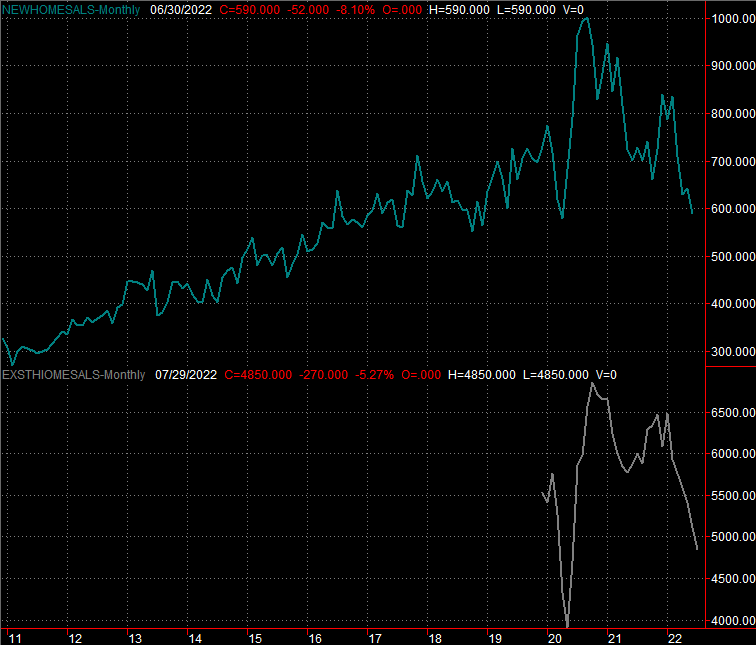
In this same vein, sales of existing homes fell a little, but at 4.81 million, sales of existing homes are nearing the low levels hit in early 2020, when the pandemic shut down nearly all types of commerce.
New and Existing Home Sales Charts
Source: U.S. Census Bureau, National Association of Realtors, TradeStation
We'll round out the home sales data this week with Monday's look at last month's sales of new homes. They're apt to have fallen only a little from June's level of 590,000, though bear in mind (as the chart above shows us) that was a multi-year low as well. Again, there's good reason to think the real estate market is in its own isolated recession.
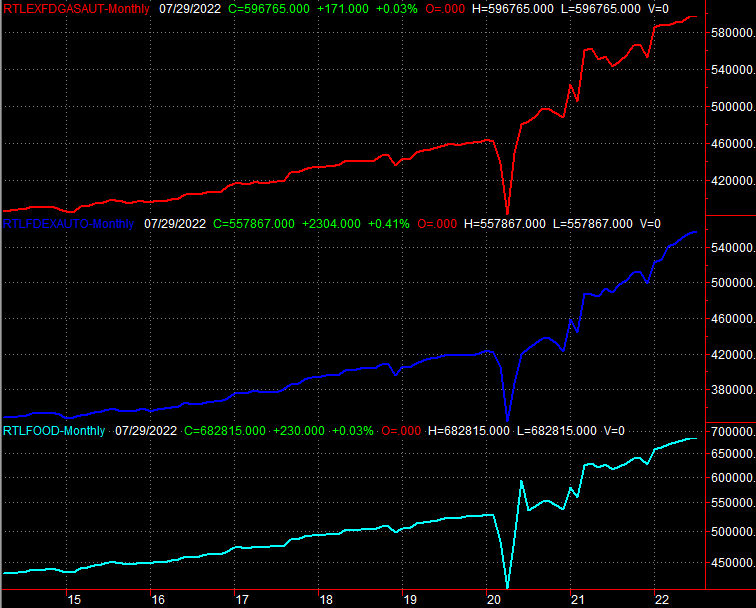
Finally, retail sales came in reasonably healthy for last month, up a little from July's reading. They look flat, or at least flatter. Most of that flattening reflects the lower price of gasoline though. Outside of that, consumers are still spending pretty briskly.
Retail Spending Charts
Source: U.S. Census Bureau, TradeStation
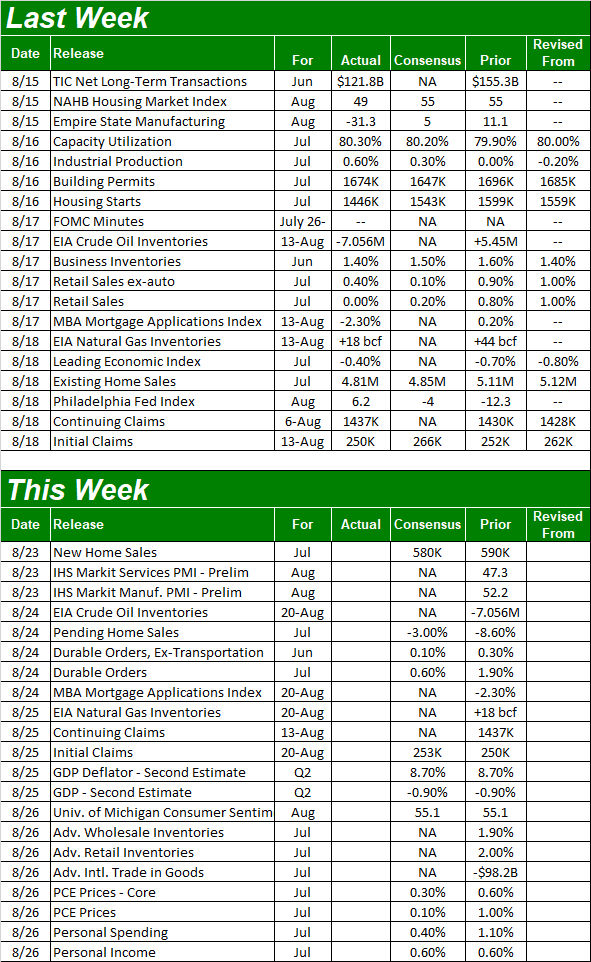
Everything else is on the grid.
Economic Calendar
Source: Briefing.com
This week's pretty well loaded. Aside from Monday's look at new home sales though, there's not a lot of news of real interest. Tuesday's pending home sales might help tell the rest of the real estate story, not that it will tell us anything we don't already know. On Thursday we'll hear the second estimate of Q2's GDP growth... or contraction. The current consensus for a 0.9% dip is the same as the first estimate.
Stock Market Index Analysis
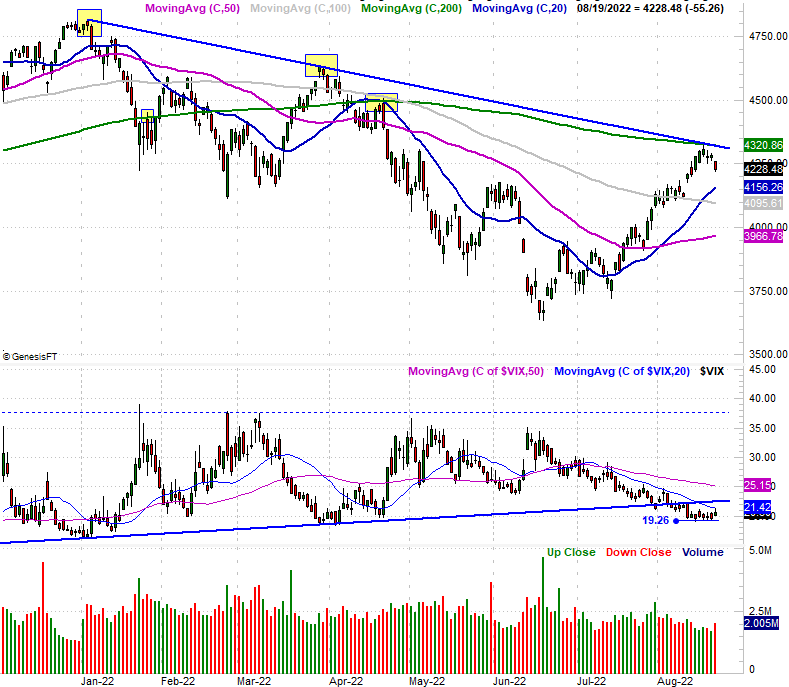
After Thursday's close, we cautioned investors that the rally that had been underway since mid-June was starting to stall at a very predictable point. Namely, last week the S&P 500 touched the technical ceiling that capped the rebound effort in late March, and also bumped into the 200-day moving average line. The index, however, didn't actually move above either of them. That pause was suspicious, even if not yet problematic.
It turned problematic on Friday. After one-too-many days of no progress, the bulls finally changed their mind, ceding to the bears. Thanks to Friday's 1.3% selloff, it's entirely possible a new downtrend is now taking shape. Take a look at the daily chart below to see. [The 200-day moving average line is green, while the straight-line ceiling is blue. The highlights point to where both have served as technical ceilings in just the past few months, making them more likely to be serving as technical ceilings now.]
S&P 500 Daily Chart, with VIX and Volume
Source: TradeNavigator
And that's not the only red flag waving here. Also on Thursday we mentioned the S&P 500 Volatility Index (VIX) was no longer moving lower, seemingly finding support at 19.3. On Friday, the VIX was pushing up and off of that floor. It didn't make meaningful upward progress, but the fact that it's even trying to do so only underscores the market's budding bearish momentum.
There's more.
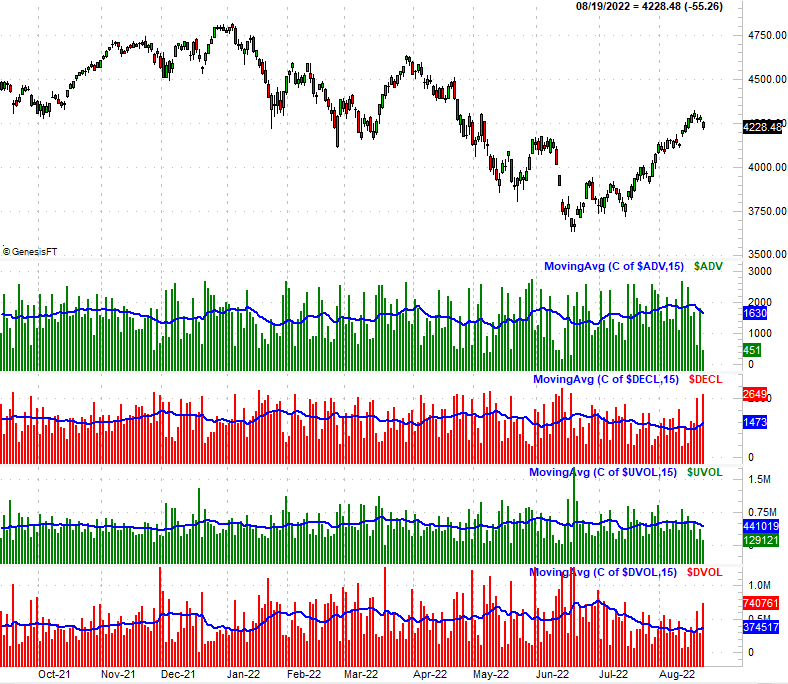
We've mentioned it a few times in recent weeks, but haven't taken a detailed look at the broad market's breadth and depth. That is to see, its daily advancers versus decliners, and its bullish and bearish volume. We've only noted that there's generally not been a lot of volume of late, particularly behind bullish days. There's just been enough (and a lack of bearish volume) to allow the rally to keep on moving.
To the extent that was -- and is -- the dynamic needed for the rally to remain in motion though, then the rally is indeed in serious trouble now. Bullish volume as well as advancers were already starting to fade before the market rolled over on Tuesday (into Wednesday), while bearish volume and daily decliners were starting to swell. Once stocks started to tip over though, bearish volume and decliners soared, and bullish volume and advancers all but dried up.
S&P 500 Daily Chart, Bullish and Bearish Volume, Advancers and Decliners
Source: TradeNavigator
The severity of this swing is telling. It tells us that traders were ready to throw in the towel on the rally, perhaps even expecting it to happen the way it did. Now that the breadth and depth tides have turned bearish, it'll be tough to reverse them without suffering a hard landing first.
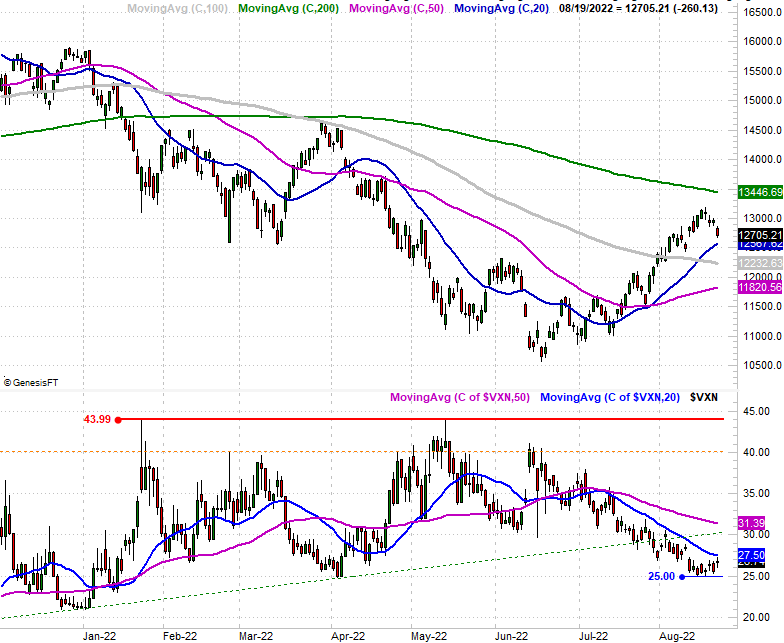
Here's the daily chart of the NASDAQ Composite. It's not dancing with any established technical ceilings, but otherwise looks the same. That is, after hitting a headwind early last week, it finally made a firm move lower on Friday. This may well have gotten a bearish ball rolling.
NASDAQ Composite Daily Chart, with VXN
Source: TradeNavigator
"May have" are the operative words here. Note that the composite is still above its 20-day moving average line (blue), while the NASDAQ's Volatility Index (VXN) hasn't yet moved above its own 20-day moving average line (blue) currently at 27.5 even though the VXN does appear to be pushing up and off of a floor at 25.0. Both will need to happen before we panic, or before we start to tack on bearish trades.
There's a fair reason we're concerned things could pan out in just the bearish way suggested here, however.
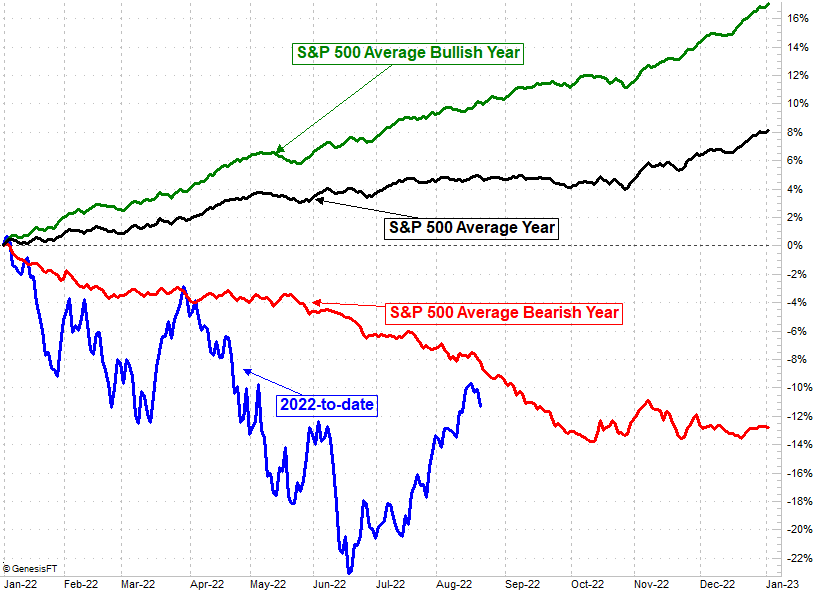
The graphic below tells the tale, plotting the market's cumulative day-to-day action... for bullish years, bearish years, and all years. This isn't a great time of year for stocks in any environment, but it's a particularly bearish time of year for years that are going to end up being bearish. It's also worth noting that thanks to the bullishness since June, the S&P 500 has moved back to about where it would be (loss-wise) in a typical bearish year. That makes it much easier and much more plausible it can begin losing ground again right now.
S&P 500 Day-by-Day Cumulative Annual Performance
Source: TradeNavigator
Like we said, last week's setback didn't actually do any technical damage, and certainly didn't do any damage that can't be undone. The market just bumped into established resistance. It may still get over those humps. The only take-away for today is, watch things closely this week. We might be on the verge of a breakdown.
