Weekly Market Outlook – The Gains Are Getting Tougher to Make

The market managed to make yet-another gain last week… the fifth in a row. But, it’s clearly losing momentum. Then again, now up nearly 12% from its late-October low, it could be expected to pause for a breather here.
There is one important red flag worth noting, however. That’s where the S&P 500 as well as the NASDAQ stopped rallying last week. Last week’s highs were in line with major prior peaks. Knowing there may be ceilings here, buyers seem hesitant to forge ahead. That might be a wise move too. Even if we’re not destined to suffer a full-blown correction here, a handful of traders might be ready to take some profits and let stocks regroup before they make their final year-end bullish push.
We’ll take a look at these possible resistance levels in a moment. Let’s first take a look at last week’s top economic announcements and then preview what’s coming this week.
Economic Data Analysis
Last week was a mixed bag of economic news. Some was good. Some wasn’t.
Among the “wasn’t” was new home sales. They fell from a September’s downwardly-revised pace of 719,000 to an annualized 679,000 for October, undermining hope that a lack of sales of existing homes would be offset with the purchase of newly-built ones. And as a reminder, October’s sales of existing homes fell to a multi-year low annualized clip of 3.79 million.
Home Sales Charts
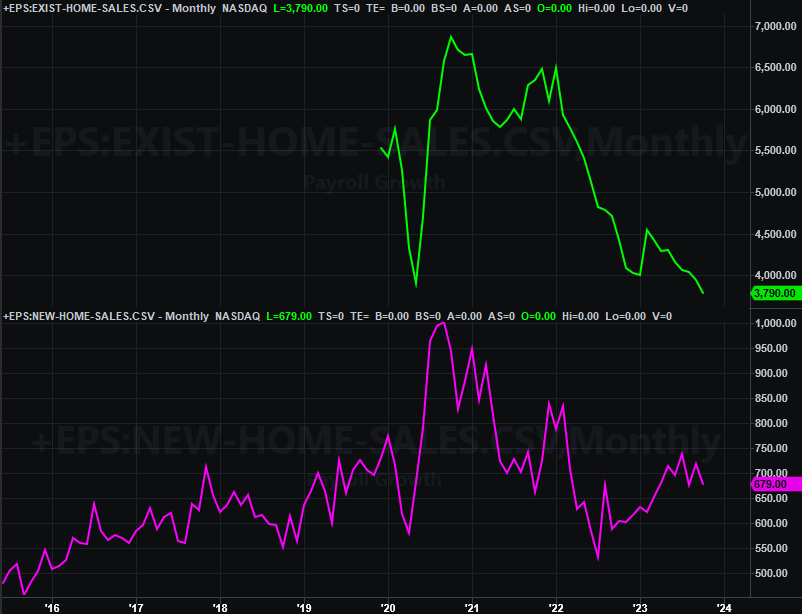
Source: National Association of Realtors, Census Bureau, TradeStation
And yet, the houses that are selling are going for a strong price. Although the Case-Shiller index is slowing down, it’s still on the rise… at least through September. Ditto for the FHFA Home Price Index
Home Price Charts
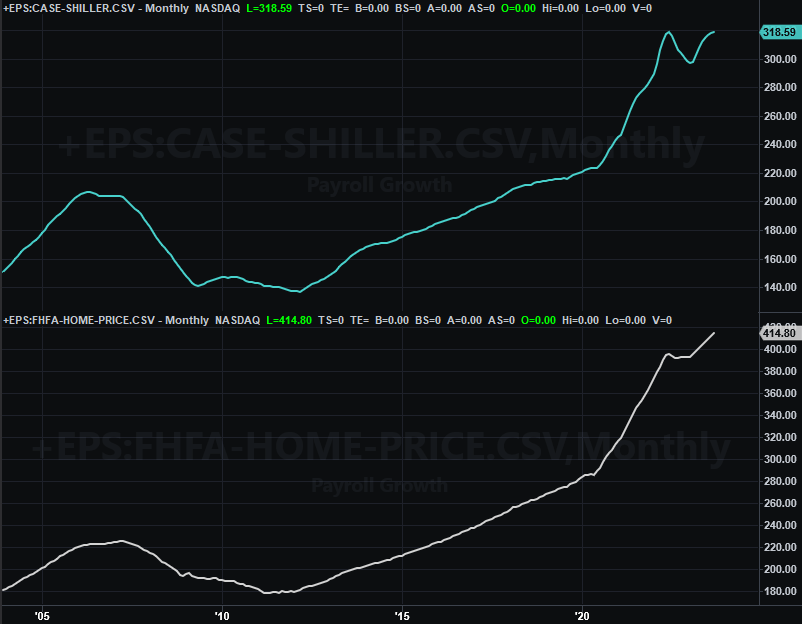
Source: FHFA, Standard & Poor’s, TradeStation
The Conference Board’s consumer confidence score for November was up a bit from October’s number, but only because October’s figure was revised lower. The bigger trend here remains a bearish one, underscored by the fact that the University of Michigan’s consumer sentiment measure is also in a clear downtrend of its own.
Consumer Sentiment Charts
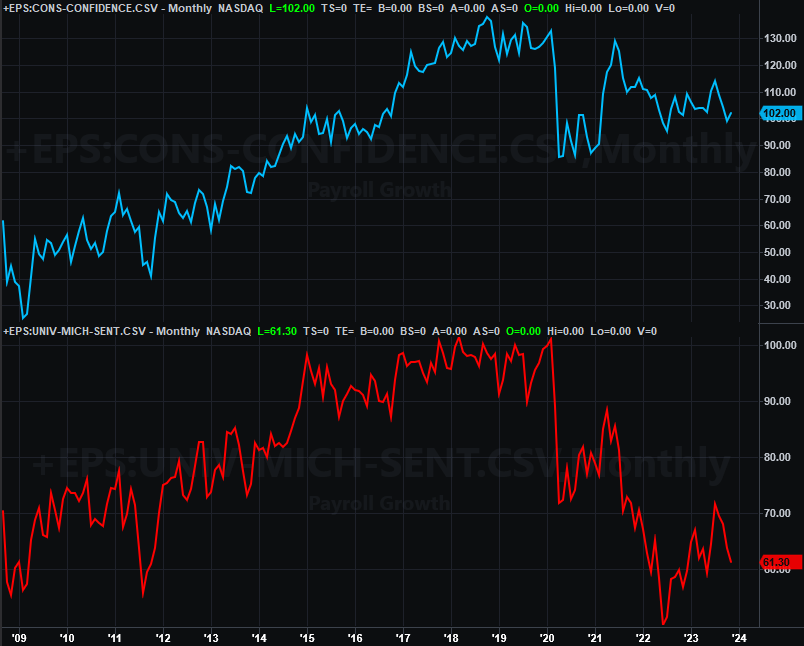
Source: Conference Board, University of Michigan, TradeStation
Other noteworthy numbers released last week that we didn’t chart above include the first look at Q3’s GDP growth rate and October’s personal income and personal expenditures data (which is largely what the Federal Reserve uses to make decisions regarding interest rates). Last quarter’s economic growth raced to 5.2%, eclipsing expectations of 5.0%. Meanwhile, income as well as spending continue to cool, giving the Fed a little bit more room to back off on rate hikes, or perhaps even lower interest rates… although Jerome Powell says it’s a little too soon to start talking about rate cuts.
Everything else is on the grid.
Economic Calendar
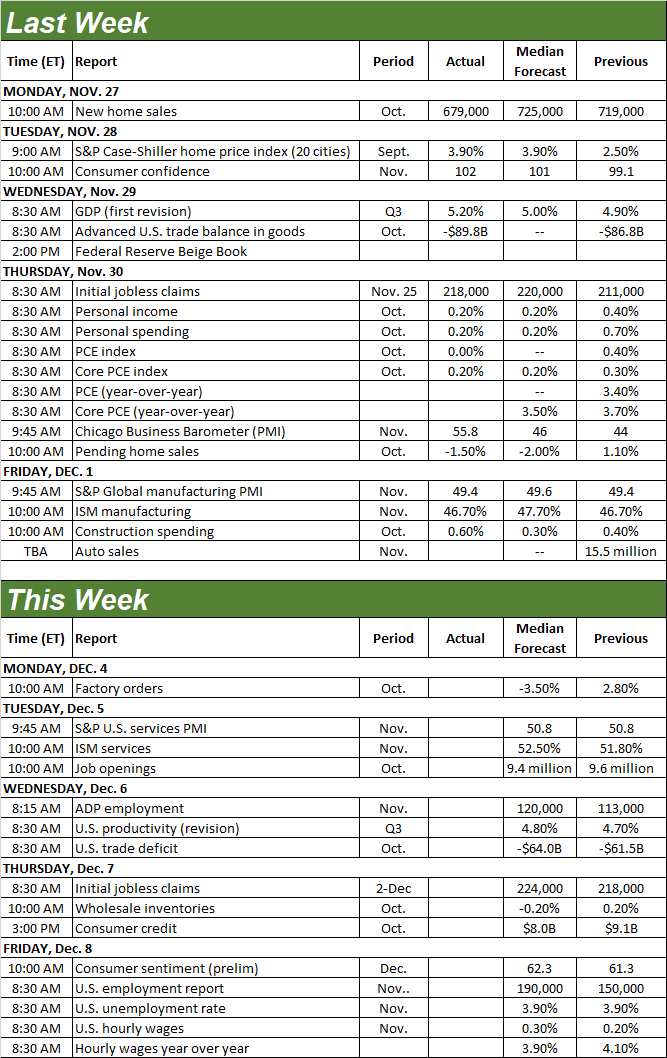
Source: Briefing.com
This week won’t be quite as busy as last week was, but we are getting a couple of biggies.
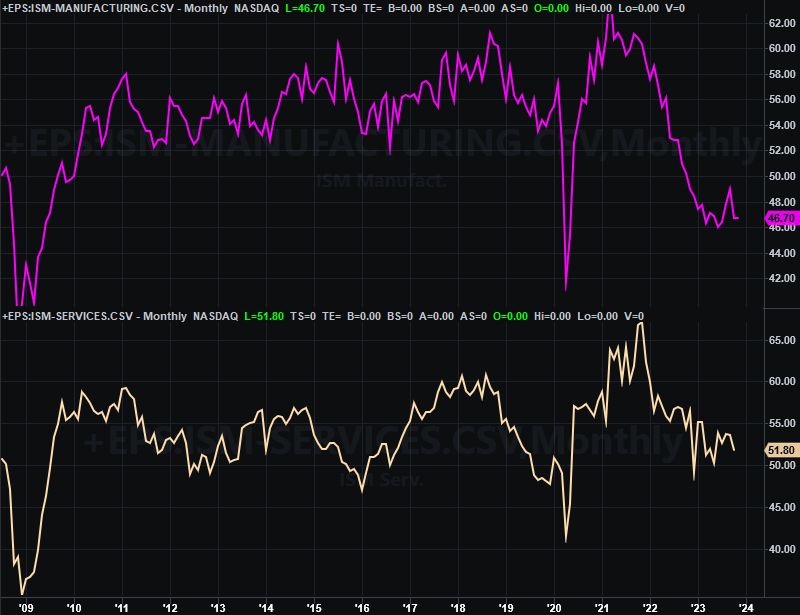
One of these is a look at last month’s services index from the Institute of Supply Management. We got the manufacturing report last week… a bit of a disappointment. Economists were expecting a slight improvement from 46.7% to 47.7%, but it didn’t budge. It’s also still well below the pivotal 50 level. Forecasters believe the services index will improve from October’s reading of 51.8% to 52.5%, which leaves the data well above 50% no matte what number we’re like to realistically get.
ISM Services, Index Charts
Source: Institute of Supply Management, TradeStation
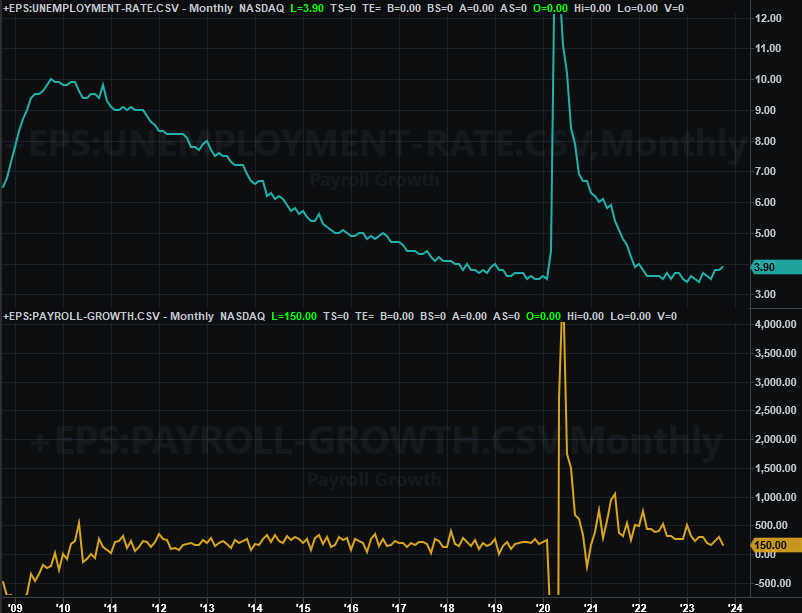
This week’s biggest news, of course, will be Friday’s jobs report. Forecasters believe the pace of job growth perked up a little in November, growing from October’s 150,000 to 190,000 for last month. That’s not enough, however, to likely lower the current unemployment rate from its current level of 3.9%. Then again, that’s already awfully low.
Unemployment Rate, Payroll Growth Charts
Source: Bureau of Labor Statistics, TradeStation
Stock Market Index Analysis
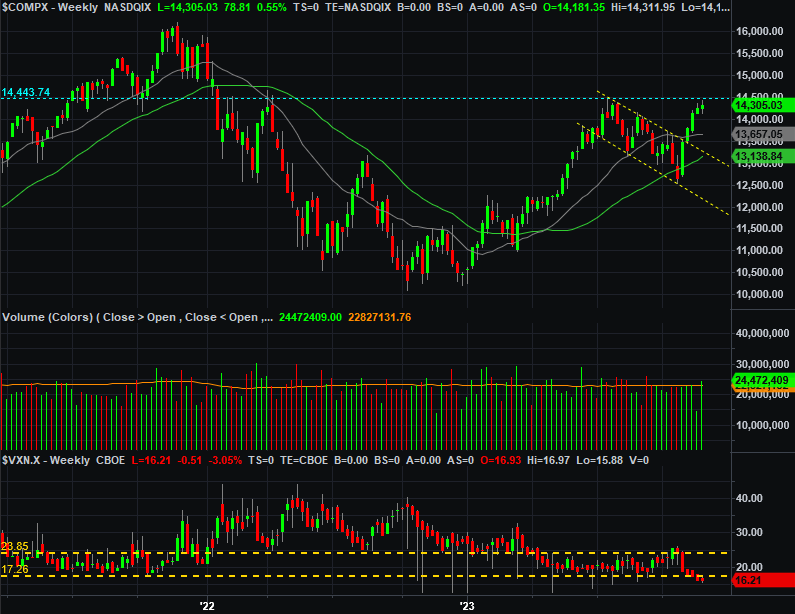
This week’s analysis begins with a look at the weekly chart of the NASDAQ Composite. It’s from this vantage point we can see a great deal about why the rally is slowing down. As the chart illustrates, July’s peak near 14,440 is coming back into play. This level was also a bit of a problem back in 2022, sparking the biggest leg of last year’s bear market after a turnaround effort ultimately failed.
NASDAQ Composite Weekly Chart, with VXN and Volume
Source: TradeNavigator
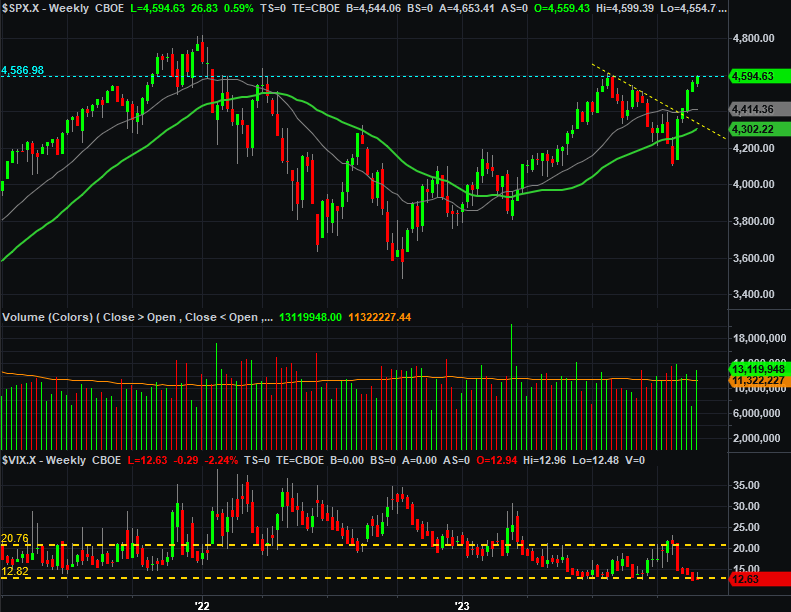
The S&P 500’s rally effort is also slowing down, although not nearly as much as the NASDAQ’s. Like the NASDAQ Composite though, the S&P 500 is suspiciously stopping right at an established technical ceiling around 4,590.
S&P 500 Weekly Chart, with VIX and Volume
Source: TradeNavigator
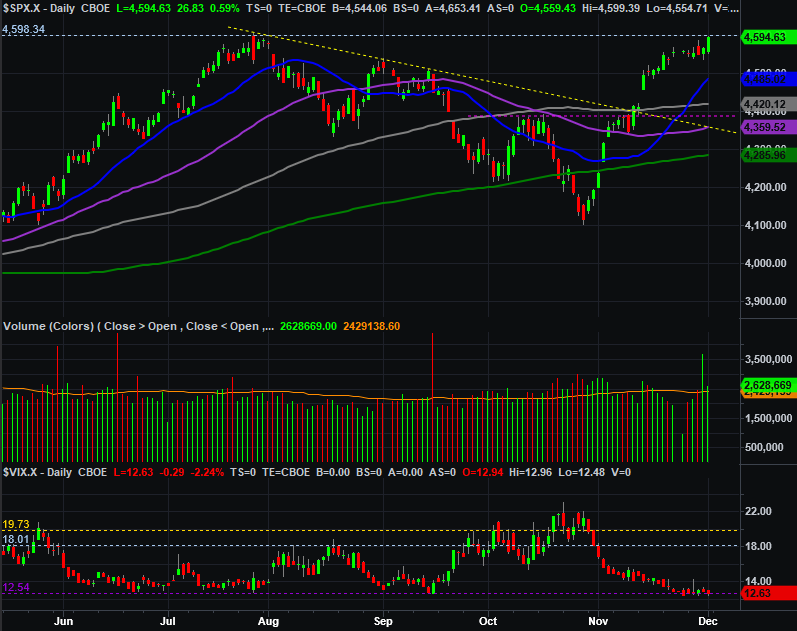
The vast majority of last week’s gain from the S&P 500 surfaced on Friday, keeping what could have been the first losing week in the past five a winner.
S&P 500 Daily Chart, with VIX and Volume
Source: TradeNavigator
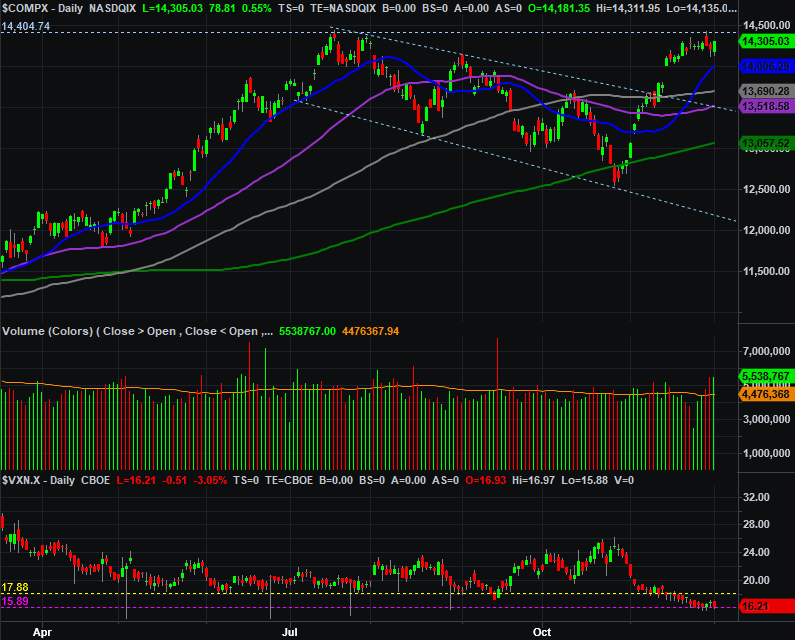
Not so for the NASDAQ. Even with Friday’s bullish jolt the composite still closed below its peak for the week reached on Wednesday.
NASDAQ Composite Daily Chart, with VXN and Volume
Source: TradeNavigator
This isn’t insignificant. The NASDAQ usually leads the overall market, higher and lower. The stock market is still moving higher, but to see the NASDAQ weaken on a relative basis may be a subtle hint that traders are becoming less aggressive.
Underscoring this possibility is the fact that traders are clearly slowing things down now that previously-established resistance lines are being tested. Further underscoring the prospect that the rally might be running out of gas is the fact that both volatility indexes are also still hovering near absolute low levels. This doesn’t inherently mean a pullback is brewing. It certainly makes it more difficult for the market to continue rallying, however.
The good news is, even of the bullishness takes a breather here, there’s plenty of support to keep any selloff from taking too much of a toll. The NASDAQ’s likely to find a floor somewhere in the 13,600 area where its 50-day and 100-day moving average lines are about to converge. That would also be enough of a pullback to fill in the gap left behind back on the 14th. The S&P 500’s most likely floor is around 4,390, where a bunch of its important lines are converging.
On the flipside, should the S&P 500 and the NASDAQ Composite manage to punch through their current resistance levels, that should spark another wave of buying. That’s not unusual given the time of year… at all. It does present a vexing problem for this time of year though. Stocks are already overbought. There may not be a ton of room left for easy gains. The ideal next move would actually be a bit of a lull so the market can finish the latter half of December on a high note.
The smart-money move right now may simply be doing nothing and waiting to see how this all plays out. It could take a few days for stocks to work their way out of a zone between support and resistance.
