Weekly Market Outlook – The Cup-and-Handle Pattern is Complete

Thanks to some last-minute heroics, stocks eked out a sixth-straight weekly win last week. As has been the case for the past three of these weeks now, however, the rally is slowing down. And, neither of the key market indices we follow has convincingly hurdled their major technical resistance levels.
Translation: We’re not out of the woods yet, as we approach what’s usually a bullish time of year. We were hoping for a slight lull early this month to set up a strong finish. Instead the market’s entering a bullish time of year already overextended. It’ll be interesting to see how things play out this year. Maybe traders are gearing up for another unlikely bullish leg.
We’ll look at all of it in a moment. Let’s first recap last week’s top economic announcements and then preview what could be market-moving this week.
Economic Data Analysis
There were only two items of interest reported last week. One of them was the update of the Institute of Supply Management’s measure of services activity. Economists expected it to improve – which it did, but by more than forecasted. The ISM services index is still above the critical 50 level, but it’s also still in a bigger-picture downtrend.
ISM Services, Index Charts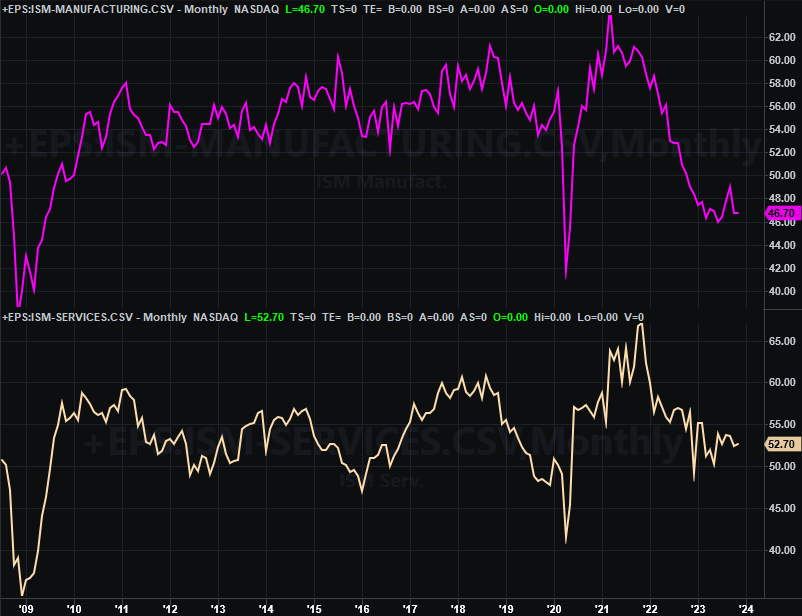
Source: Institute of Supply Management, TradeStation
Ditto for the Institute of Supply Management’s industrial index for November, which we got two weeks back. If nothing else, both of these economic barometers are moving in the wrong direction… although we at least see hints that they’re trying to push their way back into uptrends. It’s just taking some time to get those reversals going.
The only other report dropped last week was November’s jobs report. While the modest payroll growth of 199,000 jobs was a slight improvement on October’s figure, that was still enough to drive the unemployment rate down from 3.9% back down to a multi-month low of 3.7%.
Unemployment Rate, Payroll Growth Charts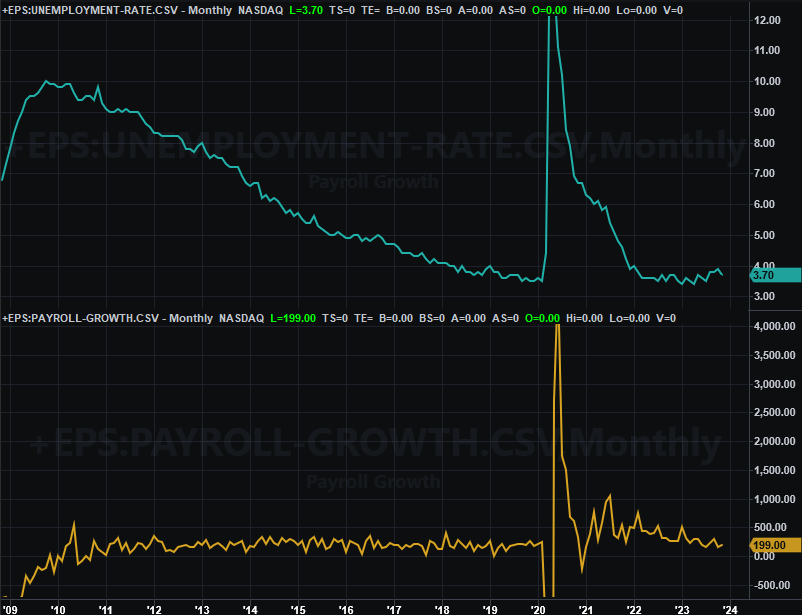
Source: Bureau of Labor Statistics, TradeStation
Note that the unemployment rate fell more than it seemingly should have simply because a bunch of people took themselves out of the labor pool, which is part of the unemployment rate’s calculation. The labor force contracted by more than 352,000 people versus the 199,000 new jobs created.
In other words, the progress isn’t quite so impressive as it may seem on the surface.
Everything else is on the grid.
Economic Calendar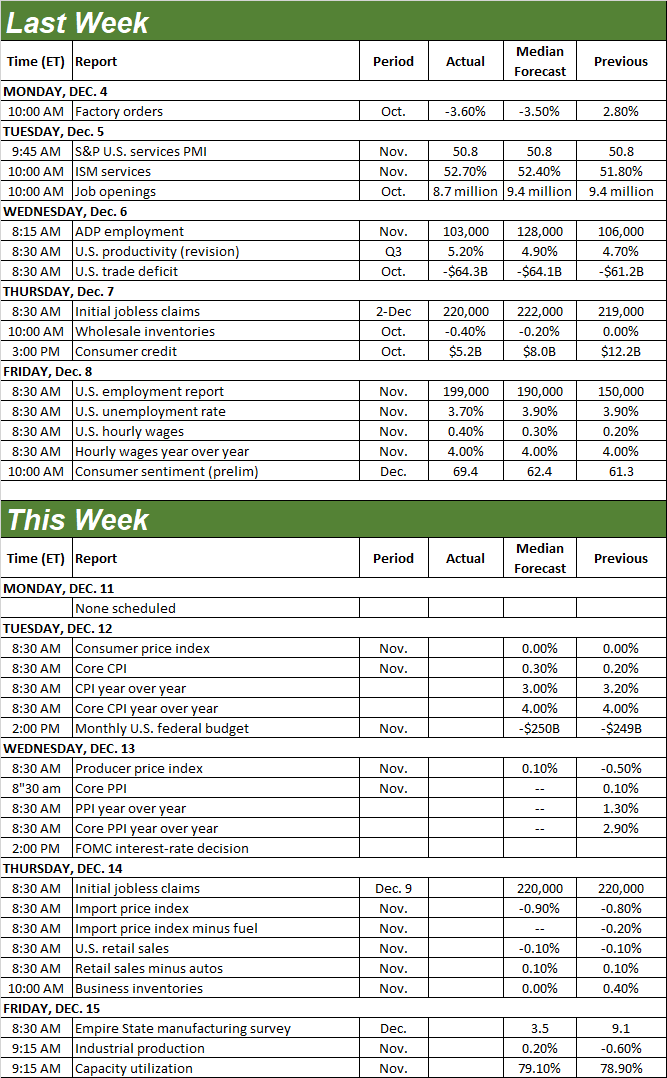
Source: Briefing.com
This week’s going to be a pretty busy one.
The party starts in earnest on Tuesday with November’s consumer inflation report, followed by producer inflation numbers on Wednesday. Look for the pace of price increases to continue slowing down. In fact, we’re within sight of the Fed’s overall target rate of 2.0%. The Federal Reserve’s got some room and reason to keep interest rates steady, and maybe even dial them back a bit. That said, the FOMC will be making the call on Wednesday of this week. Nearly everyone believes the Fed Funds rate won’t budge from its current target of 5.25% to 5.5%.
Annualized Inflation Rate Charts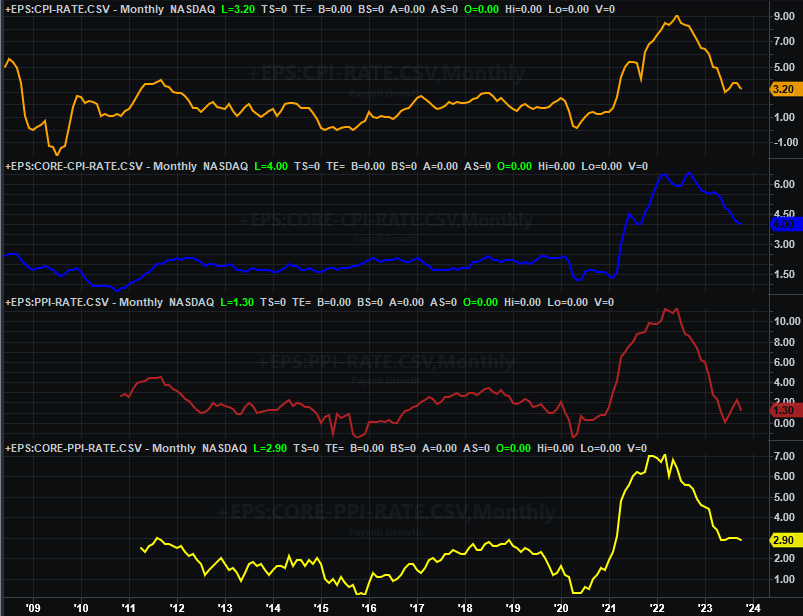
Source: Bureau of Labor Statistics, TradeStation
On Thursday we’ll hear last month’s retail sales report. Economists are looking for another tepid month, although it’s still a little too soon to sound the alarm bells. We’re slowing down from rather elevated levels seen earlier this year.
Retail Sales Charts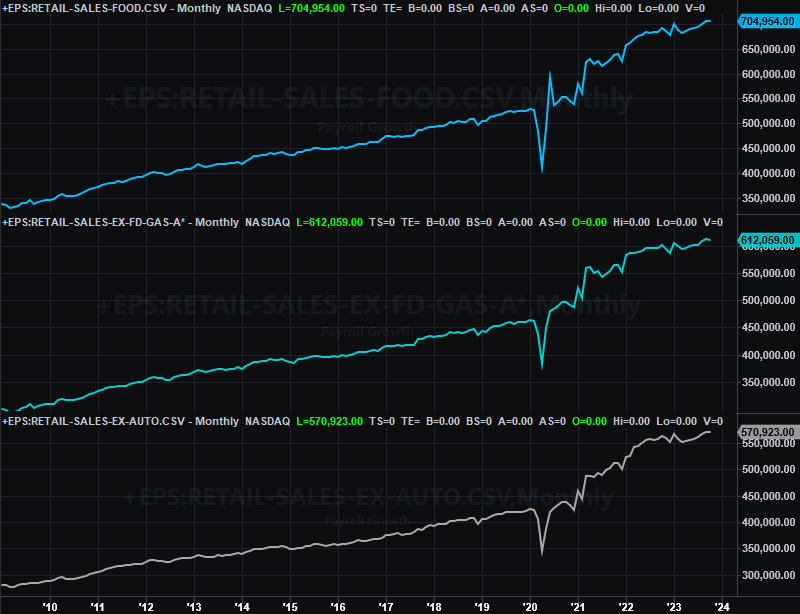
Source: Census Bureau, TradeStation
Last but not least, on Friday we’ll hear November’s capacity utilization and industrial productivity data. October’s numbers were down, extending a shallow downtrend. Forecasts call for a slight improvement this time around, although only slight. Even if we top those estimates, economic growth rates are still fading.
Industrial Productivity, Capacity Utilization Charts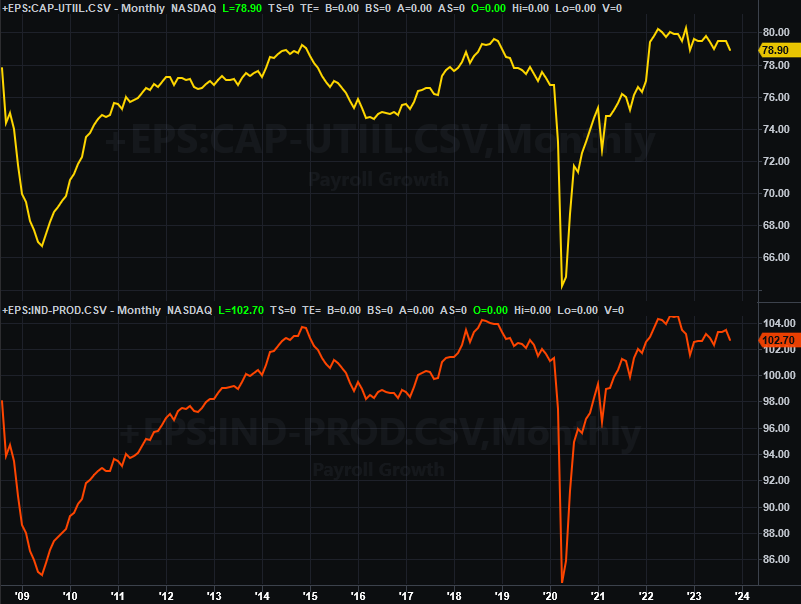
Source: Federal Reserve, TradeStation
Stock Market Index Analysis
We kick things off this week with an up-close look at the daily chart of the S&P 500; this is the vantage point we need to make the most important point that needs to be made today. And that is, even with Friday’s last-minute push, the index didn’t actually clear an important hurdle. It merely met the level where the S&P 500 peaked in July before reversing course into a rather sizeable correction.
S&P 500 Daily Chart, with VIX and Volume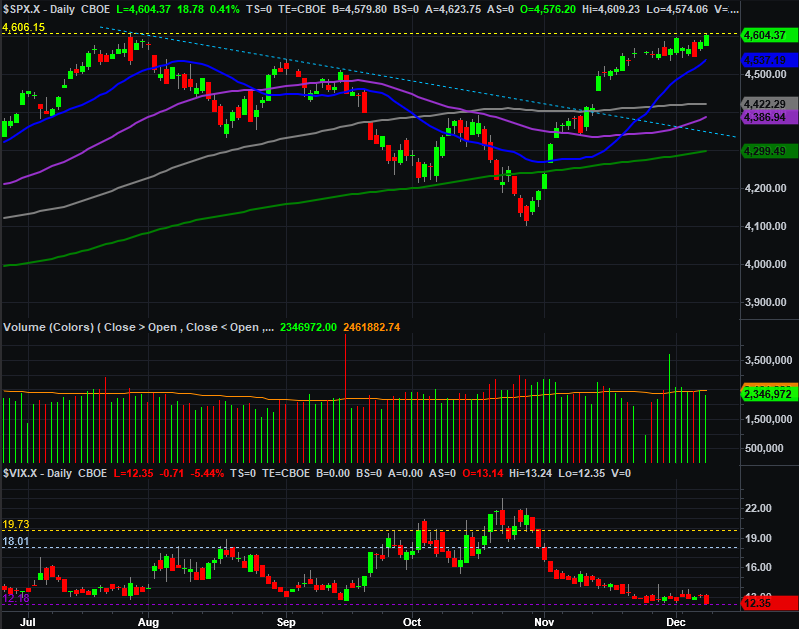
Source: TradeNavigator
It’s not necessarily the end of the world. Stocks could pick up this week where they left off last week and punch through that technical ceiling, sparking a prolonged rally that won’t bump into another ceiling. This is also a time of year that’s generally bullish, after all. Until that break above resistance actually materializes though, we can’t presume anything.
The NASDAQ Composite is telling the same basic story, but with a slightly-bullish twist. It’s testing July’s highs, but has yet to clear them. In this case, however, the composite is pushing up and off its 20-day moving average line (blue) currently at 14,181. This floor gives any breakout effort a little more “umph.”
NASDAQ Composite Weekly Chart, with VXN and Volume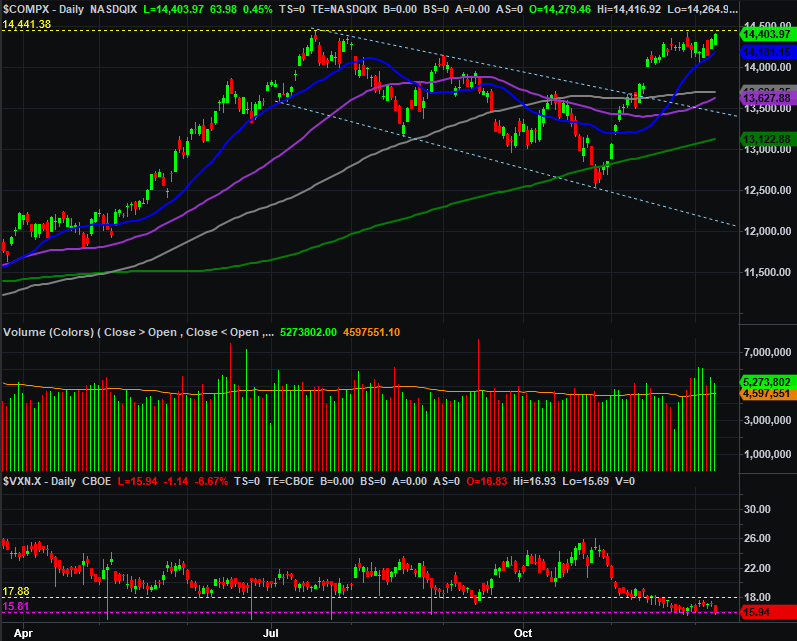
Source: TradeNavigator
Here’s the weekly chart of the S&P 500 for a little added perspective on the technical ceiling around 4600 where the index also found resistance early last year. This confirms there is a ceiling at that level, but this chart also shows us something else that’s very, very bullish… potentially. Going all the way back to the beginning of last year, the S&P 500 has made the shape of a cup and handle (with the handle being the dip and recovery since July). If this pattern is interpreted at face value, a break above the brim line of the cup at 4600 will result in a breakout thrust.
S&P 500 Weekly Chart, with VIX and Volume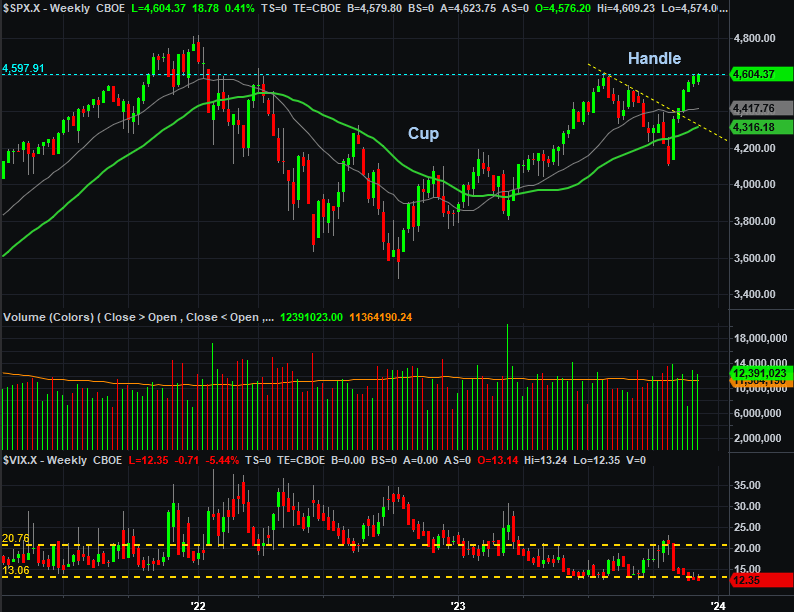
Source: TradeNavigator
And the NASDAQ Composite’s weekly chart is showing us the exact same thing. The cup and handle pattern has been formed. The only thing the bulls (theoretically) need to do know is nudge the composite above 14,400. The pattern’s undertow should take care of the rest.
NASDAQ Composite Weekly Chart, with VXN and Volume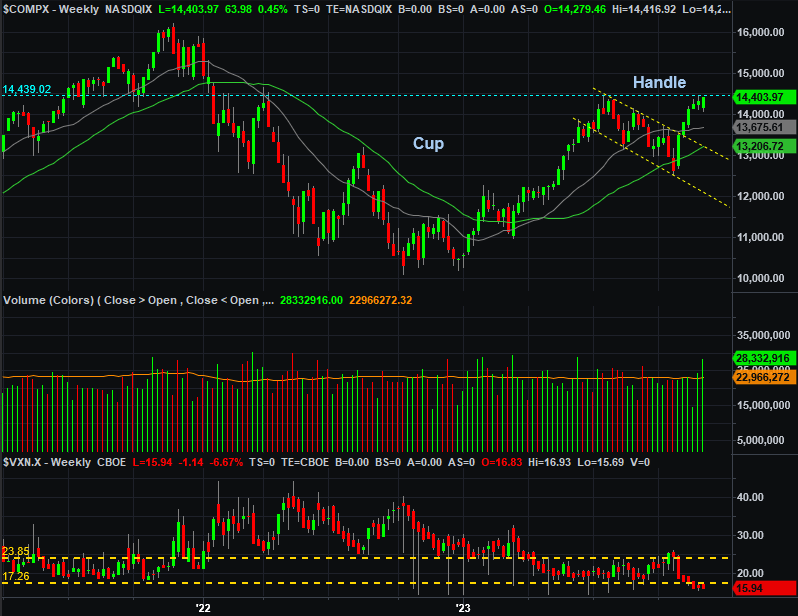
Source: TradeNavigator
There are some problems with the application of the cup-and-handle bullish theory here, not the least of which is the way both volatility indices -- the VIX and the VXN -- are so low right now. That doesn’t make it easier or more likely the market will continue to advance.
On balance though, between the bullish chart pattern, the time of year, and the fact that the Fed can afford to become at least a little bit more dovish, we have to lean bullishly here. We’d just like to see both stock indexes clear the technical ceilings they didn’t clear last week first before diving all the way in.