Weekly Market Outlook - The Crazier the Rally Gets, The More Steam it Gathers
The bears had ample opportunity to up-end the rally last week. They just didn't take it... a sign that the fear of missing out (or FOMO) is overwhelmingly high right now compared to fear of a stumble.
And, that's bullish... right up until the time it isn't. Then it's disastrous. There's the rub. You should follow the trend. When the trend is overheated like this one is though, once the music finally does stop it can all come crashing down in a hurry. As with any game of musical chairs though, it's not clear when you should get off this accelerating bullish ride.
We'll look at things in some detail below. We'll specifically look at a couple of potential problems in the market's immediate future. First though, let's look at last week most important economic reports, since one of them prompted stocks to finish the week on a (very) high note.
Economic Data Analysis
Last week's big news was May's jobs report on Friday. It was good. It was so good, in fact, it catapulted the market to a third weekly gain, and the best close in nearly ten months.
But, there were some other noteworthy announcements made last week as well... like Tuesday's look at last month's consumer confidence reading from The Conference Board. It was good... in a sense. It fell slightly from April's revised reading of 103.7, although the actual score of 102.3 was markedly better than the forecast of 99.5. Still, the bigger trend is pointed downward, as is the University of Michigan's sentiment index.
Consumer Sentiment Charts
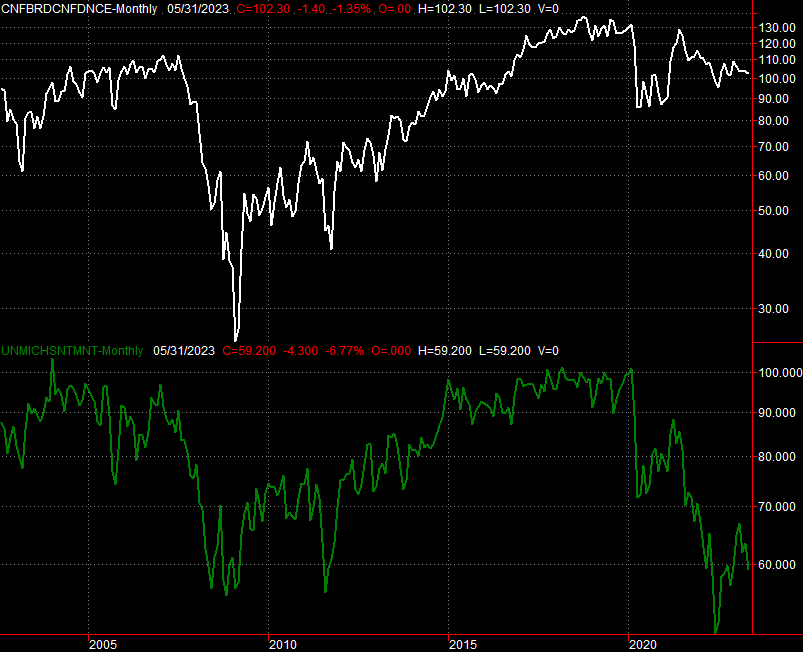
Source: University of Michigan, Conference Board, TradeStation
No, the direction consumer sentiment is moving doesn't jibe with the direction stocks are headed. Maybe consumers are unnecessarily pessimistic, though.
That's a possible takeaway from last week's look at real estate prices anyway. While they're only for March (and as such a bit dated), both the Case-Shiller 20-City Index as well as the FHFA Housing Price Index moved measurably higher with their most recent readings. That's the firmest upward move in months, suggesting what house sales that are being done are still being done at firm prices.
Home Price Index Charts
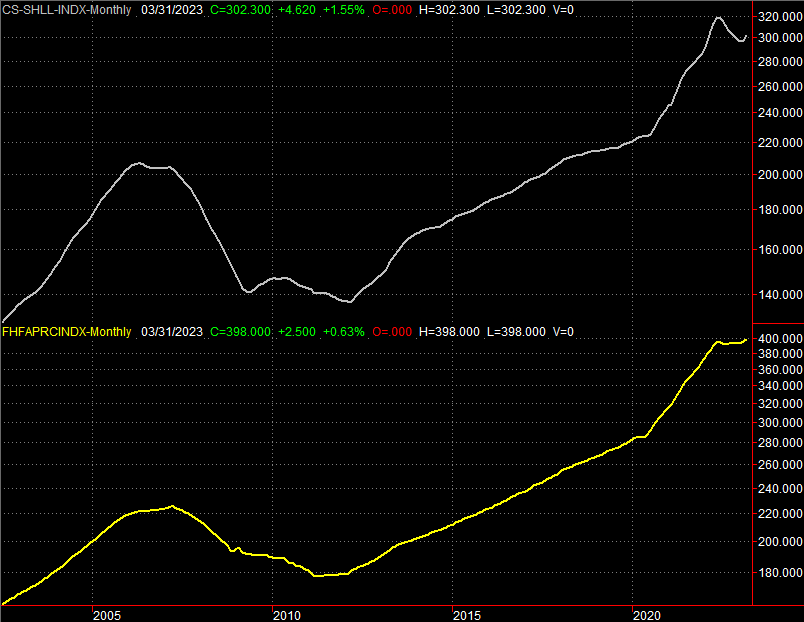
Source: Standard & Poor's, FHFA, TradeStation
Don't read too much into it though. Remember, total transactions are way, way down. The dealmaking being done may be skewed toward higher-end homes.
We also got the first round of double data for May from the Institute of Supply Management last week. That's the ISM Manufacturing Index. It slipped slightly for the month, although more than that, the reading of 46.9 remains below the pivotal 50 level. Worse, like sentiment, the manufacturing index remains in a downtrend too.
ISM Index Charts
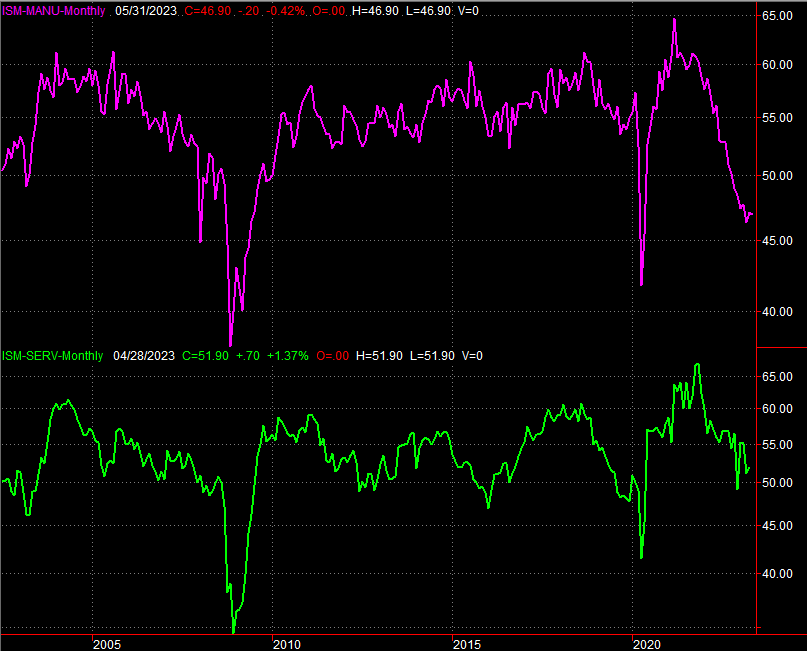
Source: Institute of Supply Management, TradeStation
The services version of ISM's economic barometers is going to be released on Monday of this week. It's above the key 50 mark, and more than that, it's expected to move a little higher. It points to a big divergence between the U.S. economy's factories and its services industries, which isn't a net-positive.
The big news, of course, was Friday's jobs report. Although the unemployment rate ticked up from 3.4% to 3.7%, that's largely because a bunch of people are reentering the workforce. The country added 339,000 new jobs for the month. That's the best growth in a few months, and easily topped expectations of only 190,000 new payrolls.
Payroll Growth, Unemployment Rate Charts
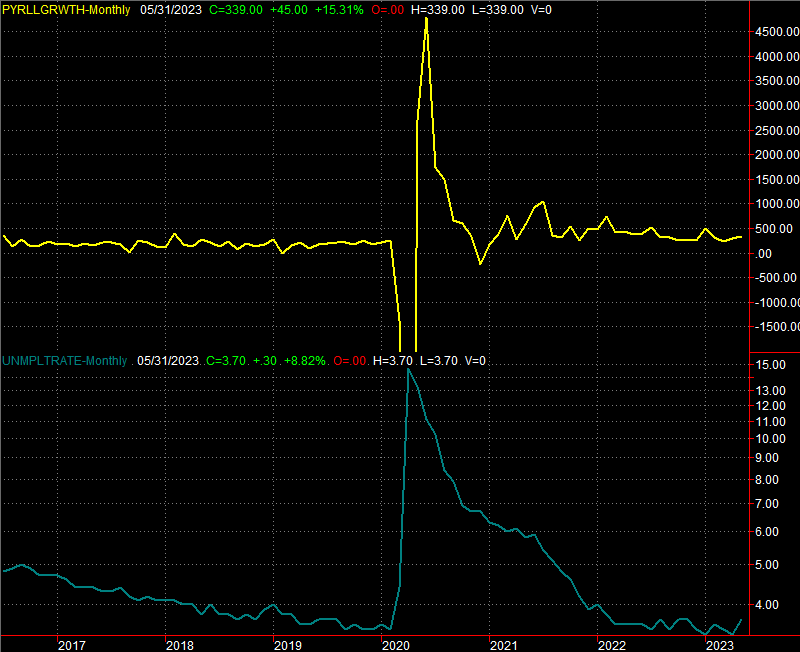
Source: Bureau of Labor Statistics, TradeStation
Everything else is on the grid.
Economic Calendar
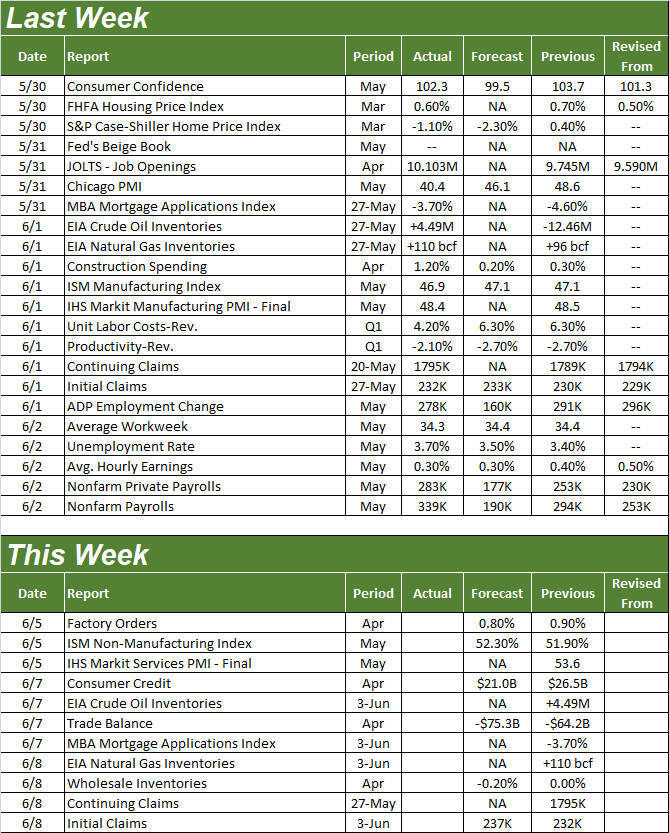
Source: Briefing.com
This week's going to be relatively light. In fact, aside from the Institute of Supply Management's look at May's services activity, there's nothing even worth previewing. It's just as well. Everyone needs to be paying close attention to the market this week after last week's big runup. The momentum is good, but it's a little too good.
Stock Market Index Analysis
We start this week's analysis with a look at the weekly chart of the NASDAQ Composite. This bigger-picture view provides us with the much-needed perspective to make sense of the more detailed daily chart.
To this end, take a look. Not only did the composite just log its third consecutive weekly win, the NASDAQ's rally since the beginning of this year is clearly accelerating.
NASDAQ Composite Weekly Chart, with VXN
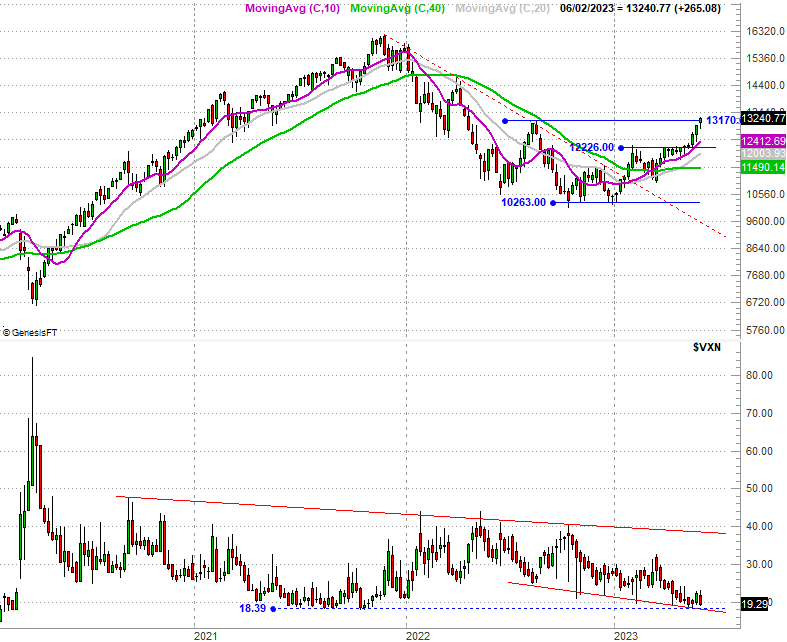
Source: TradeNavigator
That's not necessarily in the broad market's best interest right now, however.
Yes, gains are good. If the pace of the gains being made isn't sustainable though, it heightens the risk of a pullback... a big one. And the red-hot pace of the rally isn't the only thing posing a risk to stocks here. The NASDAQ's Volatility Index (VXN) is also back to a major technical floor around 18.4; that's the convergence of a horizontal as well as a falling support level. At the same time, notice how last week's high from the composite itself is more or less in line with last August's peak near 13,170.
If there was anywhere the bears were going to start pushing back, this is where they'd have the best shot at finding some success.
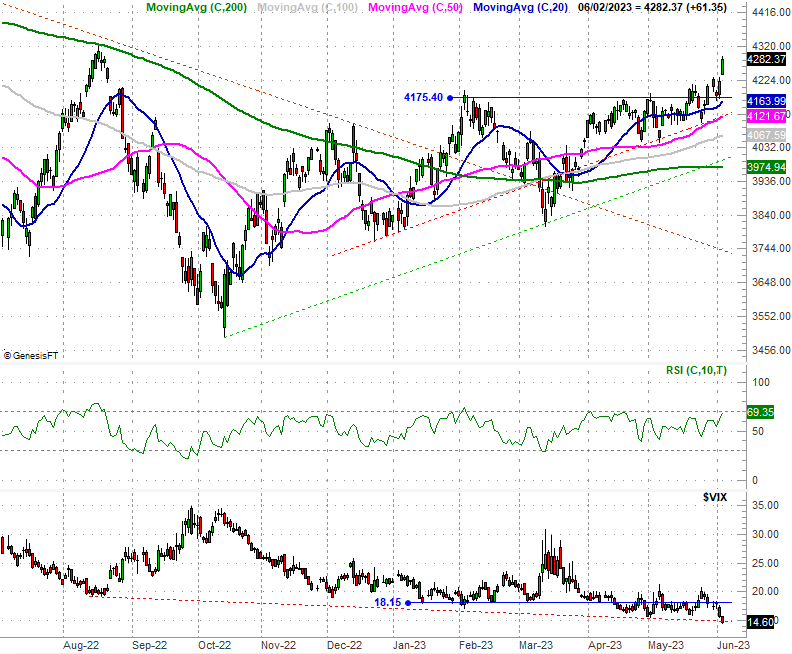
It's not just the NASDAQ Composite either. The S&P 500 is bullish-but-overextended as well... and testing critical ceilings. In this case there's a major Fibonacci retracement line at 4312, more or less where the index peaked in August. Again, if there was an ideal place for the bears to make a stand against the strained rally, this would be it.
S&P 500 Weekly Chart, with VIX
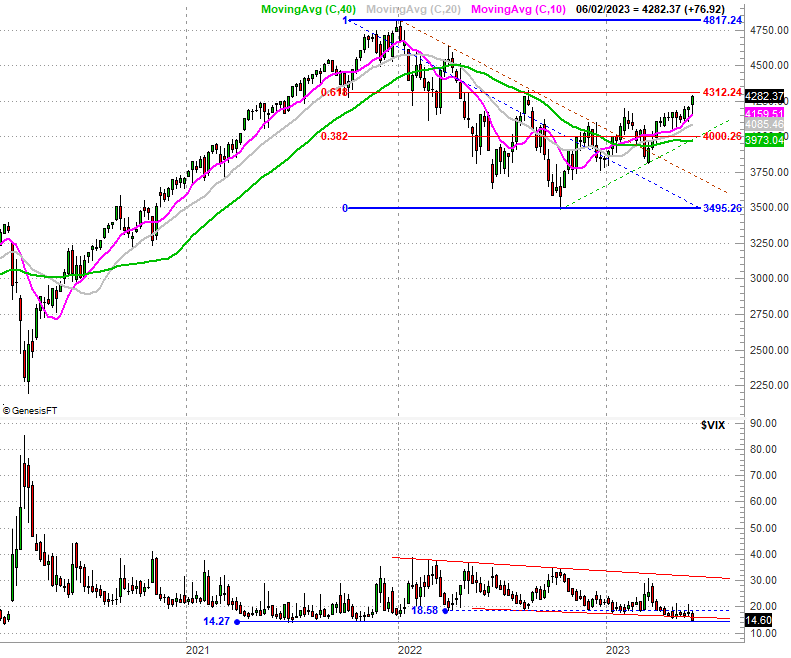
Source: TradeNavigator
The S&P 500's volatility index (VIX) is also revisiting a major floor around 15.0, bolstering the bearish case.
Here's the daily chart of the S&P 500 for a bit more detail. Notice how the index ultimately pushed up and off of a couple of different technical supports levels to log the past couple weeks' worth of gains. However, also notice how the RSI indicator is back be signaling an overbought condition. Although this isn't always the case, in recent months the market's been far more apt to fall back once the RSI line (10-day) has reached overbought status. [Knowing a particular indicator's tendencies is a big key to success in trading.]
S&P 500 Daily Chart, with VIX and RSI
Source: TradeNavigator
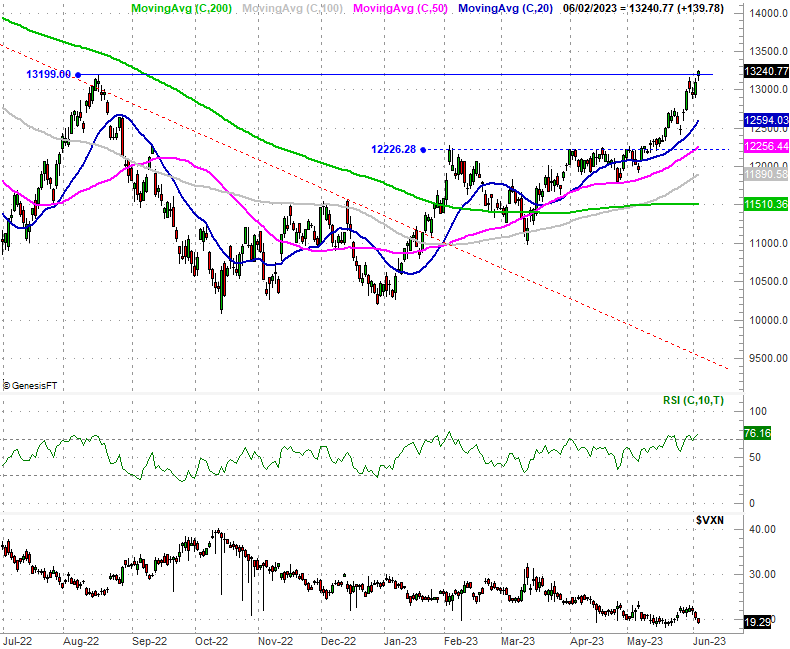
The NASDAQ Composite's daily chart look similar, although its hyperextension from December's low is far more pronounced. The composite is now priced 15% above its 200-day moving average line (green) at 11,510, which is a rarely-seen degree of divergence.
NASDAQ Composite Daily Chart, with VXN and RSI
Source: TradeNavigator
Never say never. The trend is your friend until it clearly no longer is. And, the current trend is clearly bullish.
There are limits though, and it certainly looks like the stock market is at -- or at least near -- a short-term limit. It might be best to stand back now and look for what looks like the right landing spot than try and plug into what's left of any rally effort.