Weekly Market Outlook - The Bulls Are Still In the Fight, But Just Barely
For a short while on Friday it appeared investors were going to shrug off surprisingly-high producer inflation that will all but for the Fed to remain hawkish. As the closing bell approached though, the bulls lost their nerve. Friday's lull translated into a full-week loss of around 3% for the broad market.
And yet, all of the indices remain above their last-ditch support levels. Just barely. But, that technical support maintains their fighting chance of a recovery.
We'll look at the scenario in some detail below. First, however, let's recap last week's economic reports and preview what's coming this week. The market will be looking to latch into any shred of bullish help it can.
Economic Data Analysis
As was noted, on Friday we heard last month's producer inflation figures. Overall costs for our factories and assembly plants were up 7.4%, and higher by 4.9% when taking food and fuel out of the calculation. Those are lower reading than we were seeing for the better part of the year, but they're still high. And, both came in higher than anticipated. The Federal Reserve's efforts to temper inflation may not be done yet.
Consumer, Producer Inflation Charts

Source: Institute of Supply Management, TradeStation
November's consumer inflation numbers will be posted this week. Once again they should be lower, but once again, they're still well above long-term averages. And, given how producers' costs came in unexpectedly high for last month, don't be surprised if consumer inflation for November is also above forecasts.
The only other data we got last week was the Institute of Supply Management's service index update. Economists were looking for a slight lull for last month, from 54.5 to 53.5. But, they were pleasantly surprised with a move to 56.5. The bigger trend is still downward-pointing, but that's an encouraging outcome that suggest the broad weakening may be slowing down after last month's manufacturing index update came in at 49.0, below expectations of 49.8.
Institute of Supply Management Manufacturing, Service Index Charts

Source: Institute of Supply Management, TradeStation
Everything else is on the grid.
Economic Calendar

Source: Briefing.com
All of this week's economic news above and beyond consumer inflation worth mentioning will be posted on Thursday of this week. That's last month's retail sales, and last month's industrial productivity and capacity utilization.
Retail spending should be up for November, but nowhere near as "up" as October's surge. Although sheer inflation is a key part of the recent growth, it's encouraging that consumers are still willing and able to spend more and more.
Retail Sales Charts

Source: Census Bureau, TradeStation
As for capacity utilization and industrial output, October's slight lull should be reversed a bit as well. Even so, utilization is nearing absolute maximum levels, and production aisn't exactly "bad."
Industrial Production, Capacity Utilization Charts

Source: Federal Reserve, TradeStation
Stock Market Index Analysis
It could have been worse. But, it certainly could have been better as well. The market logged its worst week since September with last week's rout, though by and large all the indices are holding just above their most important technical floors.
Take the daily chart of the S&P 500 for instance. The pullback started late in the previous week, and picked up right where it left off on Monday. The dip even dragged the index back under its 20-day moving average line (blue) that the bulls were counting on. Once the bears were required to push the S&P 500 below its 100-day moving average line (gray) at 3934 though, they balked. Indeed, the balked each of the last four days of last week, never showing any willingness to take that much bigger, bolder bearish step.
S&P 500 Daily Chart, with VIX and Volume

Source: TradeNavigator
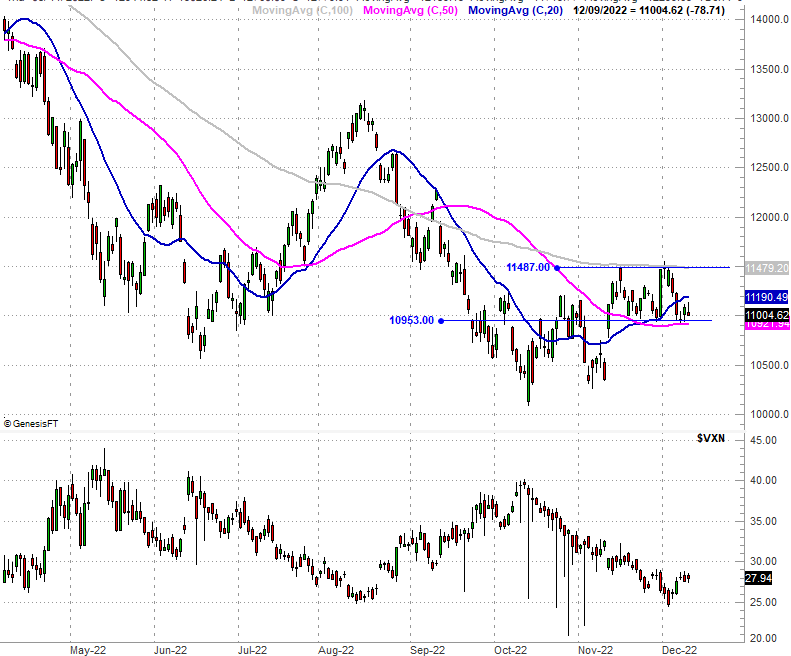
The NASDAQ Composite dished out a similar -- although not identical -- string of daily bars. We saw the index bump into a major technical ceiling near 11,487 two weeks back, and slid all the way back to a support level at 10,953 as a result. As was the case with the S&P 500 though, the sellers didn't dare push any further.
NASDAQ Composite Daily Chart, with VXN
Source: TradeNavigator
None of this inherently means the market has escaped doom. It just means the bears are taking a breather. This is exactly where you'd expect them to do so. Sometimes it takes a bit of work to put a full-blown breakdown into motion. That's still a distinct possibility here, particularly given how the sellers continued taking swing all last week rather than pushing up and off these floors.
There's no chart for it this week, but know that the Dow Jones Industrial Average found the exact same problem and the exact same reprieve last week.
Zooming out to the weekly charts doesn't tell us anything new. But, it does provide more perspective, particularly as it pertains to the index's technical floors and ceilings. They've all been off-and-on problems and help for months now, but they're extremely meaningful now.
As an example, the S&P 500's peak from two weeks back is in line with all the major peaks going back to January's peak (red, dashed).
S&P 500 Weekly Chart, with VIX and Volume

Source: TradeNavigator
The NASDAQ Composite's dance with the 50-day (purple) and 100-day (gray) moving average lines has been erratic this year, but has tightened up rather dramatically in just the past few weeks. This is the sort of action you'd normally expect to see at major turning points... which in this case would be a pivot out of a downtrend and into an uptrend.
NASDAQ Composite Weekly Chart, with VXN

Source: TradeNavigator
Bottom line? Keep your powder dry for now. It's not unusual for the market to be trapped between support and resistance. The current floors and ceilings, however, are all incredibly strong and well-defined. It could take a bit of time for either side of the table to punch their way past their current hurdles, and a breakout is still as likely as a breakdown.