Weekly Market Outlook – That Was Just Good Enough To Change Everything
Two weeks ago the market was hanging on for dear life. One week ago stocks were knocking on the door of a bullish breakout. Now, the stock market is above the last of any prospective technical ceilings. That’s how quickly things can change in this game.
Now what? Well, as was noted, the market really is breaking out. On the other hand, one always has to respect the fact that (as was the case over the course of the past couple of weeks) things can and do stop and turn on a dime. It’s possible this rally could wither just as quickly as it materialized. Given what we can see and know though, we have every reason to trust this current bullish momentum.
We’ll look at how many technical hurdles stocks cleared last week on a moment. Let’s first preview the economic news that’s in the lineup for this week.
Economic Data Analysis
If you keep close tabs on market-related news then you already know there were no major economic announcements to consider last week. That’s ok though. We’re more than making up for that lull this week.
Economic Calendar
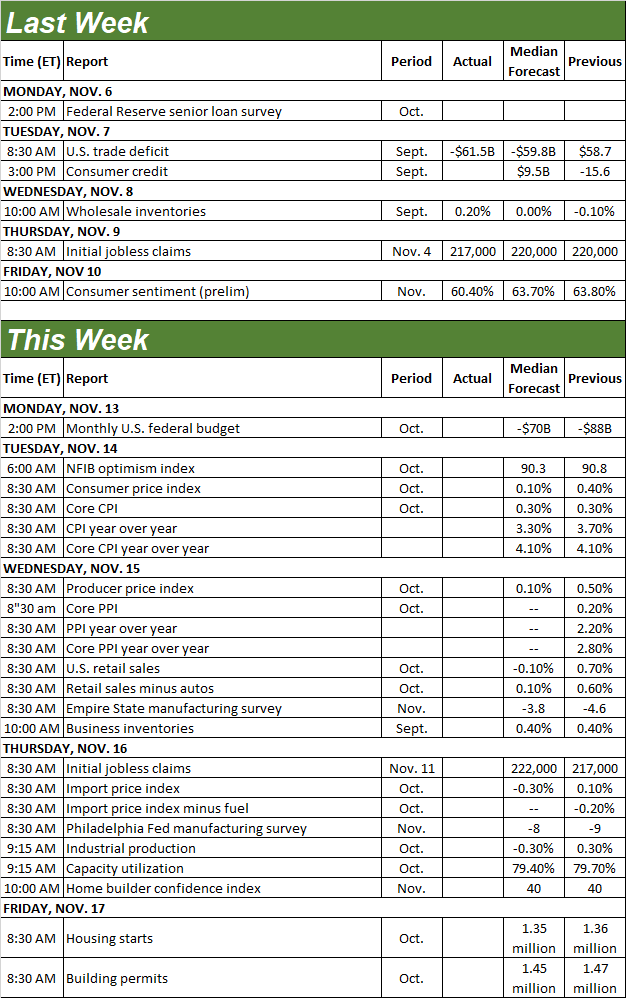
Source: Briefing.com
The party starts in earnest on Tuesday, with a look at last month’s consumer inflation data. Producer price inflation numbers will be posted on Wednesday. Price and cost increases were curbed just a bit on September after a surprising August surge. Economists believe they’ll fall again. Just bear in mind annualized inflation rates are still above the Fed’s target levels. The question is just whether or not the trajectory is steep enough to satisfy the Fed’s mission to steer the economy into a soft landing.
Annualized Inflation Rate Charts
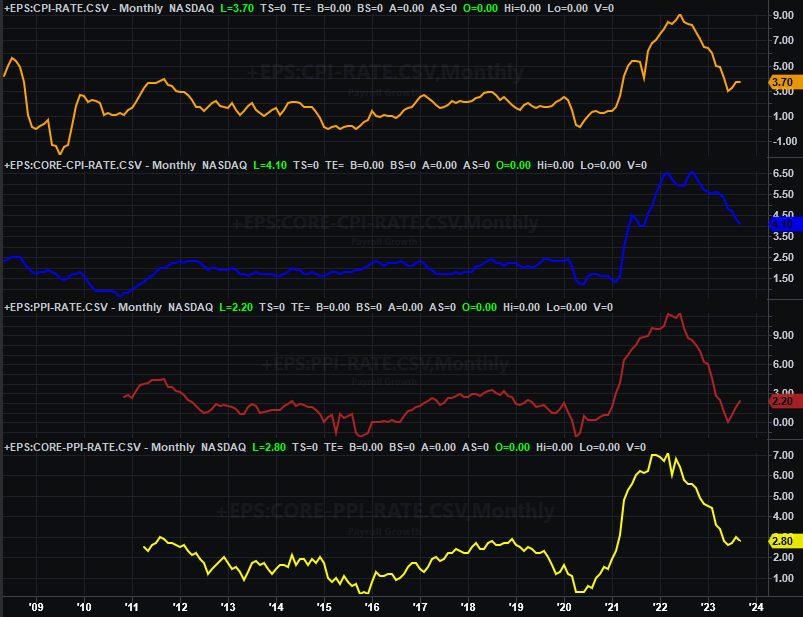
Source: Bureau of Labor Statistics, TradeStation
Also on Wednesday we’ll hear last month’s retail sales numbers. We saw strong growth in September, but we’re not likely to see that pace persist. Economists are more or less looking for retail spending that was flat with September’s data. Even so, the bigger trends here remain encouraging.
Retail Sales Charts
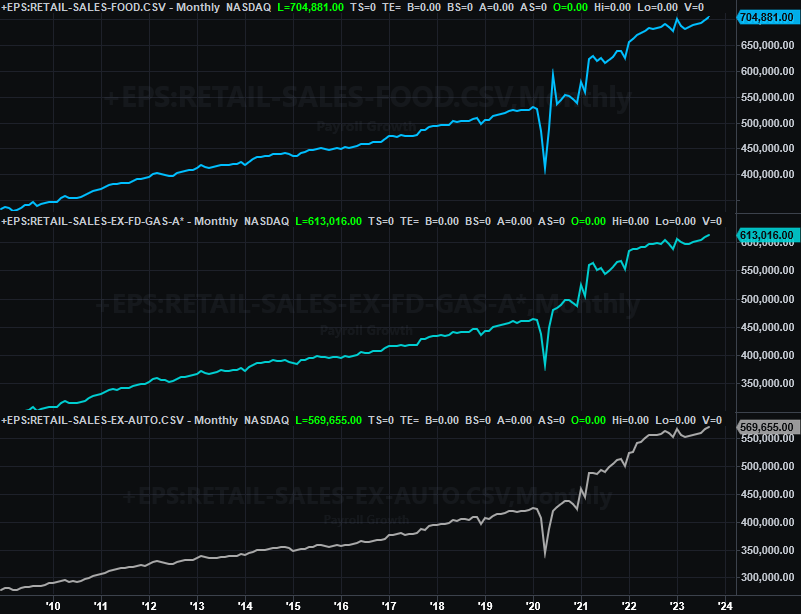
Source: Census Bureau, TradeStation
Look for last month’s industrial productivity and capacity utilization numbers on Thursday. And, don’t dismiss their impact. While they may or may not move the market around in the near-term, there’s a strong correlation between them and the long-term market trend and corporate earnings. That’s why the expected dip of both data sets is a bit concerning, as it could mark the beginning of a new downtrend for both.
Capacity Utilization and Industrial Productivity Charts
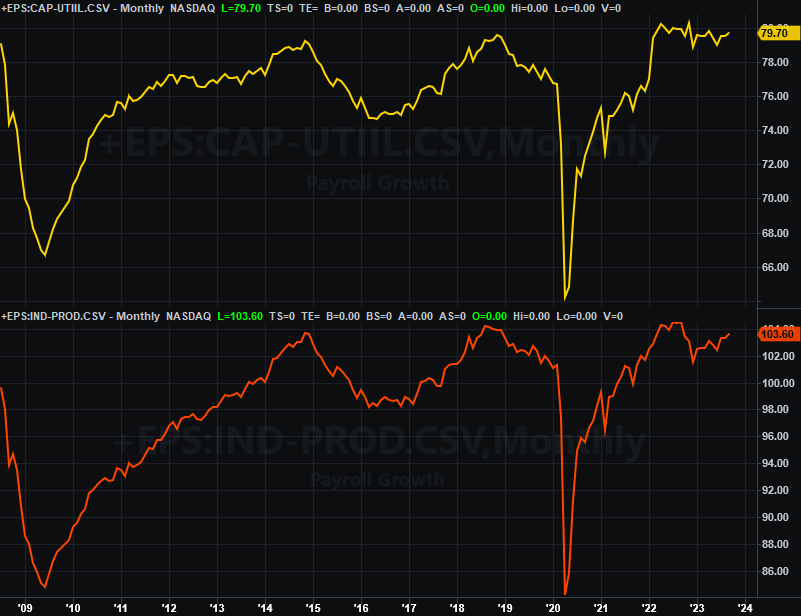
Source: Federal Reserve, TradeStation
Of course, one disappointing month doesn’t necessarily mean a new trend has begun. The longer-term trend remains bullish here… for now.
Last but not least, we’ll get October’s housing starts and building permits reports on Friday. They should be right around September’s numbers… which weren’t particularly great.
Housing Starts and Building Permits Charts
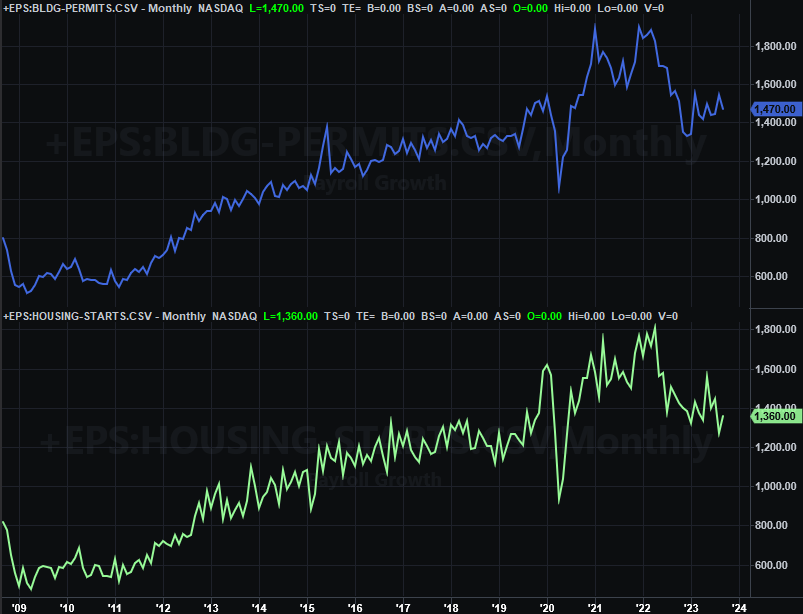
Source: Census Bureau, TradeStation
Starts and permits are of course a function not just of economic strength, but interest rates and demand for new housing as well (which is a function of supply of existing homes for sale, which has been unusually low as well). Even a measurable improvement on September’s starts and permits won’t be a decisive victory here. It could take months for housing starts and building permits to truly get back on a bullish track.
Stock Market Index Analysis
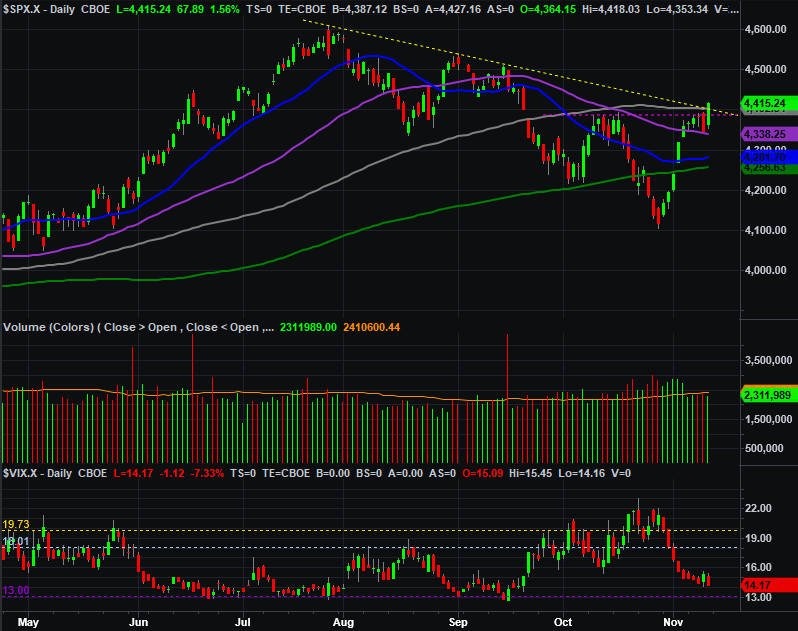
We kick things off this week with a look at the S&P 500’s daily chart, as it shows us several hurdles were finally cleared with Friday’s bullish finish to the week. Thanks to that big reversal of Thursday’s tumble, the index broke above its 100-day moving average line (gray) at 4405 as well as the falling resistance line (yellow, dashed) that had connected all the key highs going back to July’s peak. With that last bit of bullish effort, there’s no technical ceiling left to hold the market back.
S&P 500 Daily Chart, with VIX and Volume
Source: TradeNavigator
Here’s the weekly chart, for some additional perspective. It’s easier to see here just how wildly bullish the past two weeks have been, sharply reversing a similarly-sizeable two-week selloff. Also take note of the fact that the next most-likely technical ceiling from here is at 4587, where the index not only peaked in July but also back in April of last year. There’s probably something to that level worth watching. Also note that the S&P 500’s volatility index (VIX) is once again near an absolute floor around 13.0.
S&P 500 Weekly Chart, with VIX and Volume
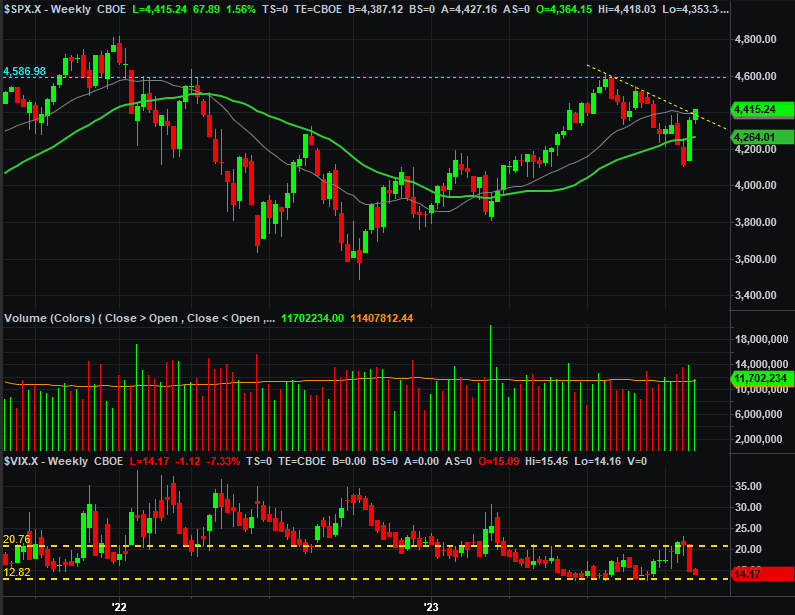
Source: TradeNavigator
Nothing looks dramatically different for the NASDAQ Composite’s chart. Pushing up and off of a major technical support level -- the lower boundary of a falling trading range -- to end up pushing past the upper boundary of that same range. With that, the composite is also back above all of its key moving average lines as well.
NASDAQ Composite Daily Chart, with VXN and Volume
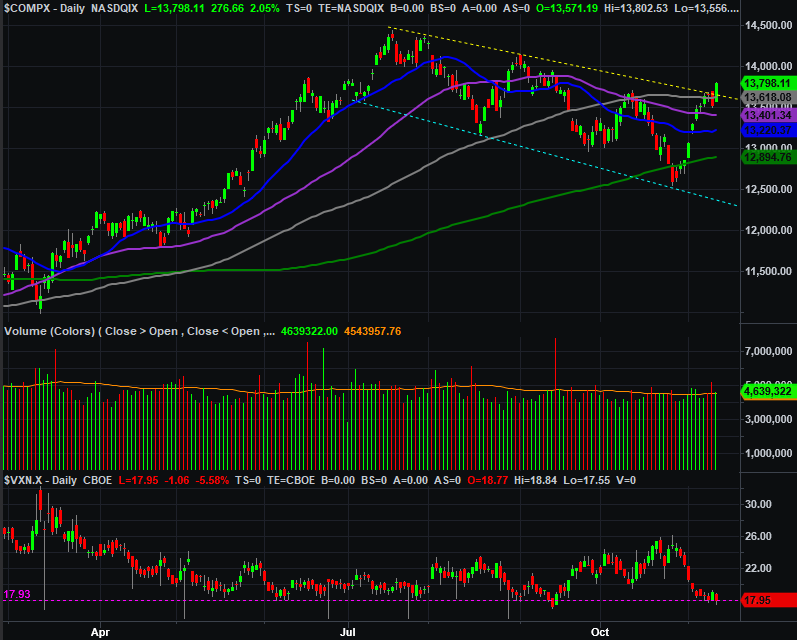
Source: TradeNavigator
Also notice that, like the VIX, the NASDAQ’s volatility index (VXN) is back at a well-established technical floor. This should (in theory anyway) make it tougher for the NASDAQ to continue trekking higher.
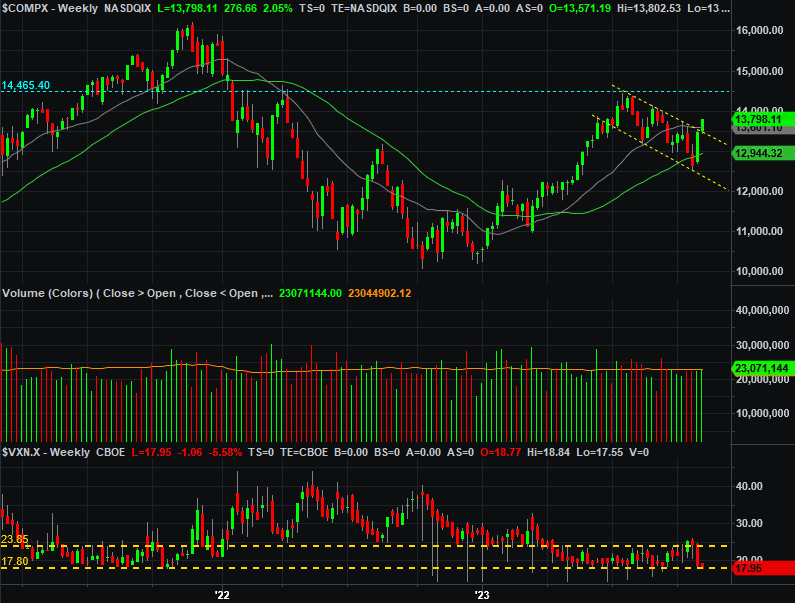
Here’s the weekly chart of the NASDAQ Composite. The only thing to add here is to point out the next most-likely technical ceiling to keep tabs on. That’s 14,465, where the composite peaked in July, but also where the NASDAQ ran into resistance in the early part of last year.
NASDAQ Composite Weekly Chart, with VXN and Volume
Source: TradeNavigator
So now what? The momentum is bullish, but this isn’t the ideal breakout effort.
Although rallies can and do sometimes start with a jolt, the S&P 500’s 7.4% romp over the course of the past two weeks is a lot of ground to cover in that much time. Stocks are vulnerable to profit-taking here, which could kick-start a more sustained selloff.
On the flipside, the prior three months were also oddly bearish, and this is more or less when and how the usual year-end bullishness usually starts.
As such, the smart-money move to make here is perhaps doing nothing other than waiting to see how this all pans out. We’d really like to see how well stocks stand up to their next serious bearish test. If they can stand up to that headwind and/or find support at one of the indexes’ key moving average lines, that’s arguably a lower-risk, higher-odds entry point.