Weekly Market Outlook – Subtle Hints of Bullishness Are Surfacing. Will It Be Enough?
Trying as hard as it could, the market just couldn’t work its way back into the black for the week on Friday. The bulls gave up on the effort mid-day, in fact, dragging the S&P 500 to a loss of 0.27% for the day, and leading to a loss of 0.7% for the week. It was the fourth losing week in a row for the index, pushing a quick end to the bearish effort further out of reach.
Of course, nobody can be too surprised. This is a bearish time of year for stocks anyway, and a particularly poor phase for the third year of a president9ial term.
The good news is, if it’s the cyclicality of the market causing this weakness, it could -- and should -- abate soon enough. October’s usually when the seasonal weakness starts to turn around, leading into the usual year-end bullishness.
We’ll look at the odds and tendencies in a moment. Let’s first work through last week’s major economic news and preview what’s coming this week. Both are pretty well loaded.
Economic Data Analysis
What a week, particularly for real estate data. The party start on Tuesday with a look at last month’s new homes sales, following up the previous week’s report on sales of existing homes in August. The only problem is, like existing homes, new home sales fell about as much as expected from July’s upward-revised pace.
New, Existing Home Sales Charts
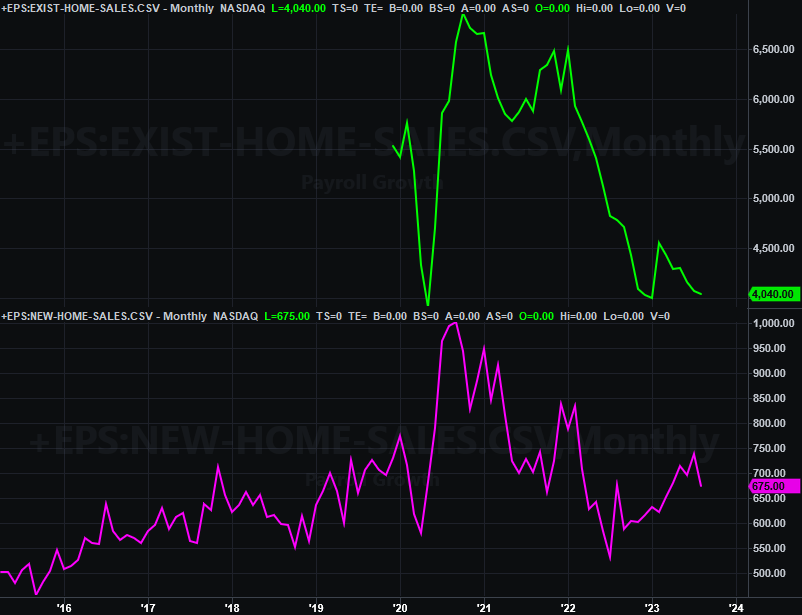
Source: Census Bureau, National Association of Realtors, TradeStation
This is a legitimate reason for concern. New homes had been a glimmer of hope for the entirety of the real estate market. But, now it’s clear that higher mortgage rates and a generally-lethargic economy are more than it can withstand.
And that’s an important piece of information to keep in mind in light of the other important piece of real estate data reported this past week… home prices. Although home prices once again made forward progress, bear in mind fewer and fewer homes are being sold at these ever-rising prices.
Home Price Charts
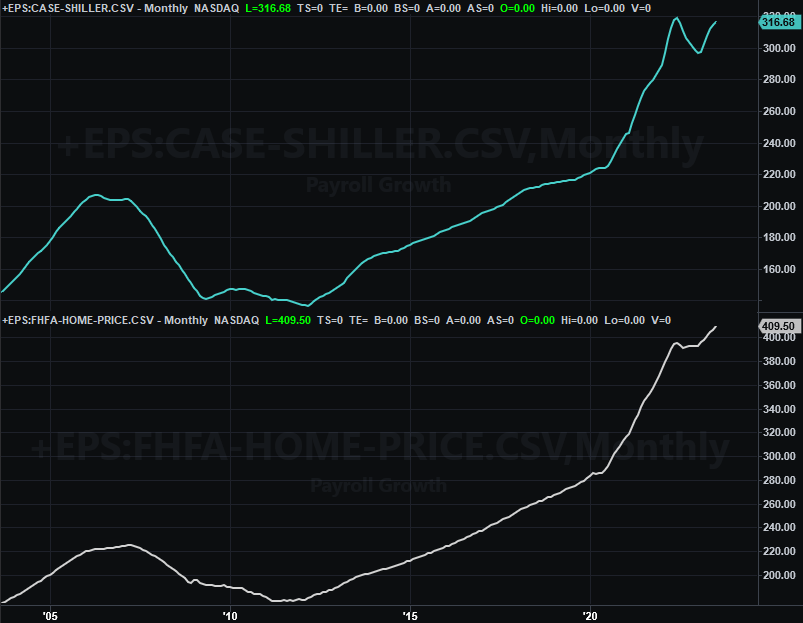
Source: FHFA, Standard & Poor’s, TradeStation
It’s unlikely these two disparate trends will remain in opposition to one another indefinitely.
Finally (and as could have been expected), after a healthy streak of improvement consumer sentiment is starting to buckle. Both the Conference Board’s consumer confidence measure and the University of Michigan’s consumer sentiment index peeled back just a bit in September.
Consumer Sentiment Charts
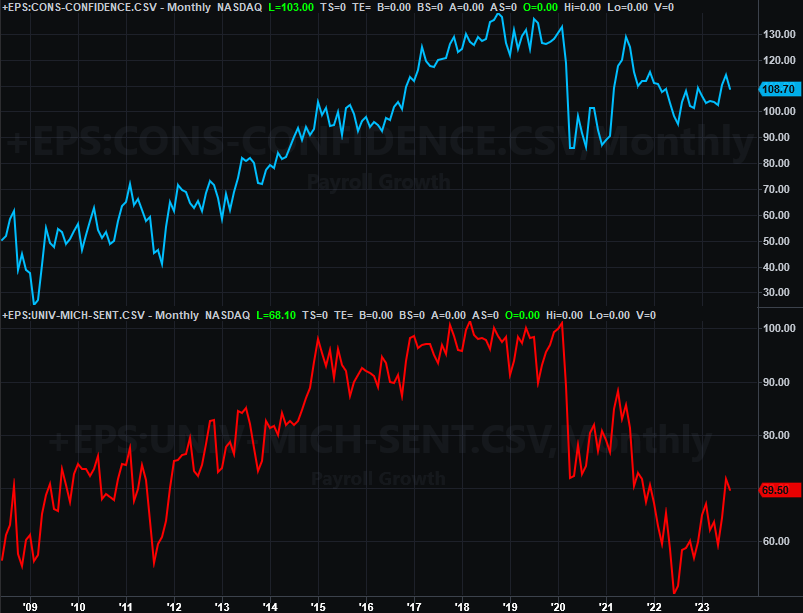
Source: Conference Board, University of Michigan, TradeStation
It’s too soon to panic just yet. Last month’s lulls are so slight that they could be chalked up to mere volatility. Nevertheless, it’s a stumble worth keeping an eye in case another setback materializes in October.
Everything else is on the grid.
Economic Calendar
Source: Briefing.com
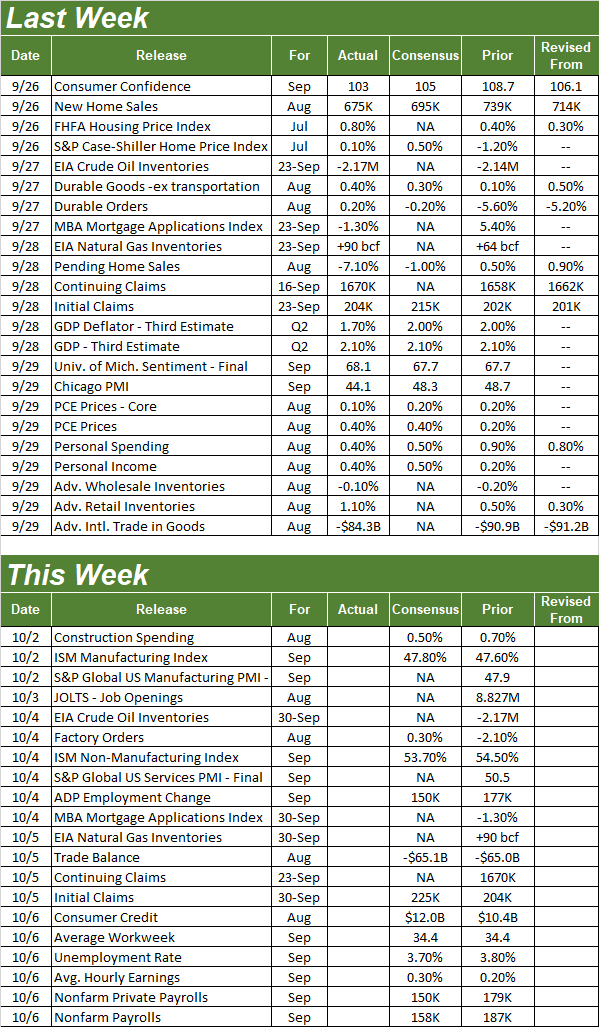
This week’s biggest news will also be the grand finale… Friday’s jobs report for last month. But, there is some noteworthy economic news in the lineup between now and then. On Monday we’ll get September’s manufacturing activity update from the Institute of Supply Management, with the services version of the group’s economic barometer scheduled for Wednesday. Manufacturing should be about even, although economists are looking for a slight dip in the services index. Note that both are hammering out turnaround efforts that won’t necessarily be rattled by one lackluster month.
ISM Manufacturing and Services Index Charts
Source: Institute of Supply Management, TradeStation
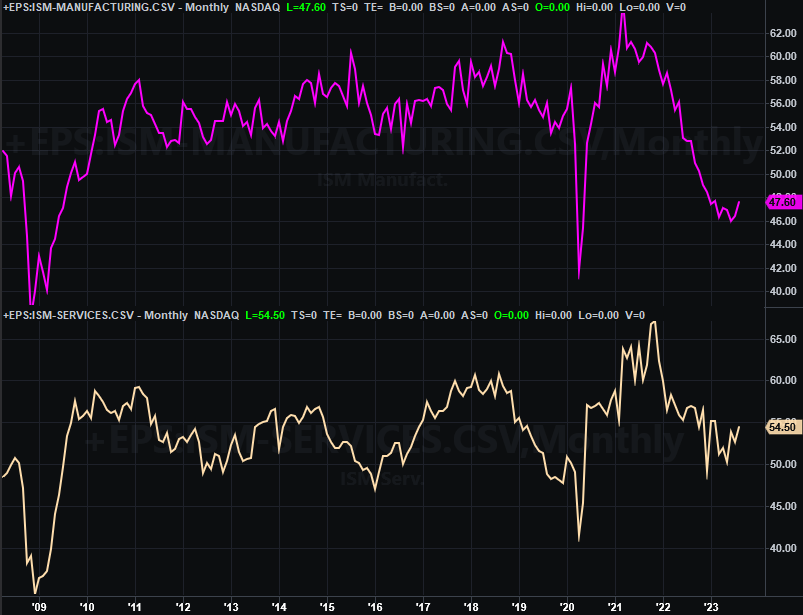
Friday’s jobs report, of course, is this week’s biggie. Economists are looking for a slower pace of job growth, compared to August’s payroll growth that was already pretty tepid. Yet, these same forecasters believe there will be enough net growth to dial back the unemployment rate from 3.8% to 3.7%.
Payroll Growth and Unemployment Rate Charts
Source: Bureau of Labor Statistics, TradeStation
Perhaps these analysts are right. A disappointing jobs report, however, is arguably the stock market’s biggest vulnerability right now.
Stock Market Index Analysis
On the fence… caught between a rock and a hard place… whatever you want to call it. The market could just as easily go in either direction from here, with good reason to expect both possibilities.
Even so, on balance it’s still the bulls that need to prove something at this time. The bears have the ball, so to speak.
Nowhere is all of this more evident -- and more confusing -- than on and with the daily chart of the S&P 500. Last week we pointed out that the horizontal support line (yellow, dashed) at 4331 that has been a floor a couple of times in the middle of the year had been broken. Well, Friday’s failed recovery effort verified that former floor is now a ceiling. Yet, even with that rekindled selling effort the S&P 500 remains above a couple of major technical support levels. One of them is the 200-day moving average line (green) at 4200. The other is the straight-line support (light blue, dashed) line that more or less connects Thursday’s low with March’s low as well as last October’s low.
S&P 500 Daily Chart, with VIX and Volume
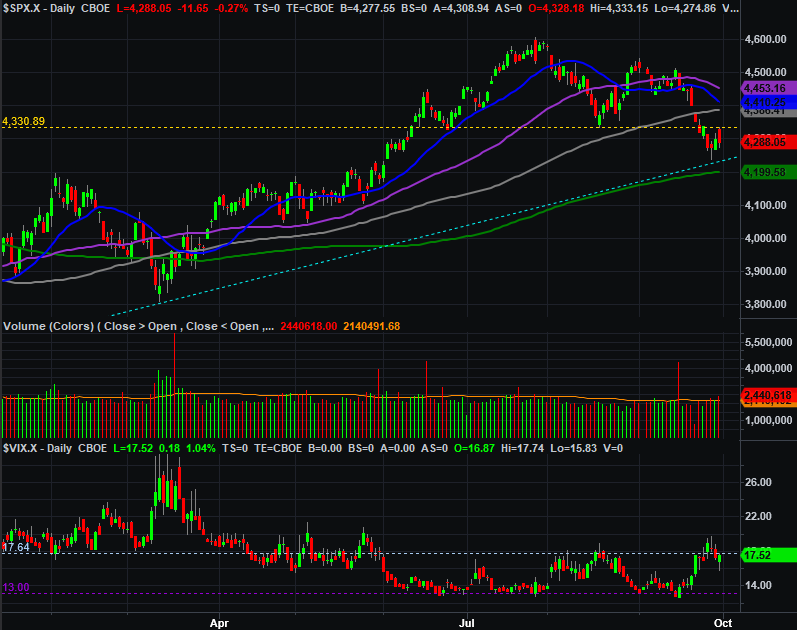
Source: TradeNavigator
Here’s the weekly chart of the S&P 500 for a little more perspective on that long-term straight-line floor.
S&P 500 Weekly Chart, with VIX and Volume
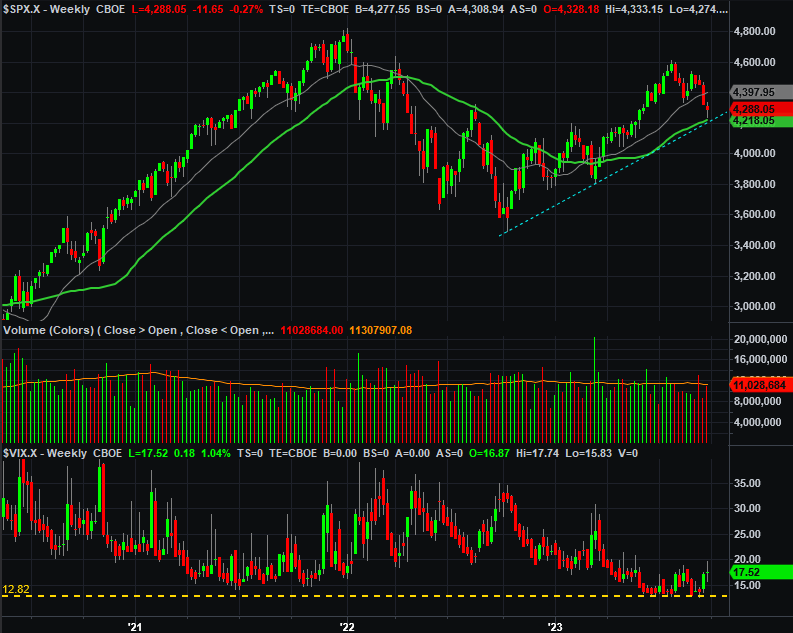
Source: TradeNavigator
If there’s an ideal spot for the bulls to push back, we’re at it. And, given that the S&P 500 has fallen a hefty 5.2% in just the past four weeks, the market’s certainly primed for a little pushback.
Underscoring this prospect is the fact that the NASDAQ Composite isn’t in the same basic sort of trouble that the S&P 500 is. Rather, the NASDAQ managed to fight its way back above August’s low near 13,157, and remain above that mark even with Friday’s intraday rollover. And as the weekly chart also shows is, the composite is finding support at the same straight-line support level connecting last October’s low to March’s low to -- now -- Thursday’s low (light blue, dashed).
NASDAQ Composite Weekly Chart, with VXN
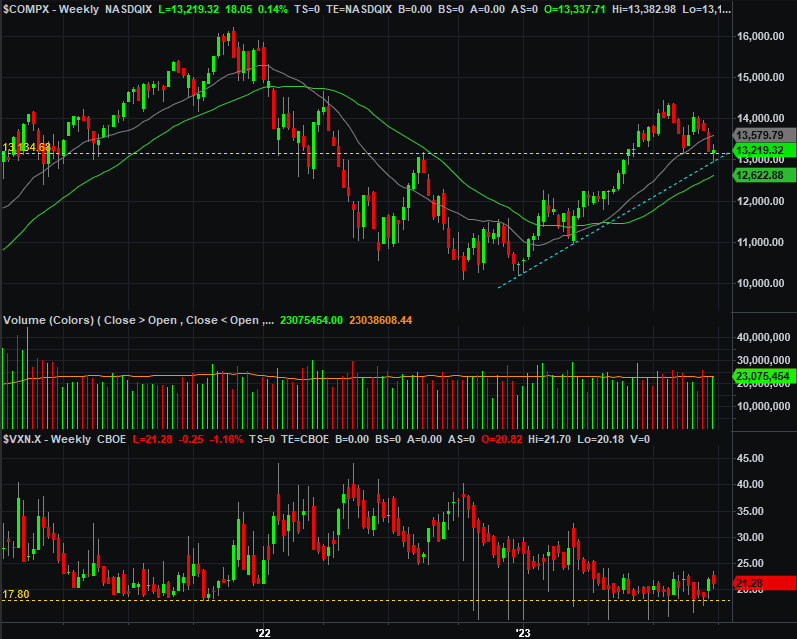
Source: TradeNavigator
Nevertheless (and as was noted), it’s the bulls that will ultimately need to prove their mettle here. The momentum is still net-bearish, and if you look closely you’ll see the selling volume behind last week’s most bearish days is starting to come in above its recent average. The charts also suggest both volatility indexes are fighting to go higher… which is generally bearish for stocks. They just need one more good “umph” to get there. You can even see the 20-day moving average lines (blue) have already fallen under their 50-day averages (purple), and both are close to moving under their 100-day moving average lines (gray). Again, that sets a rather bearish tone.
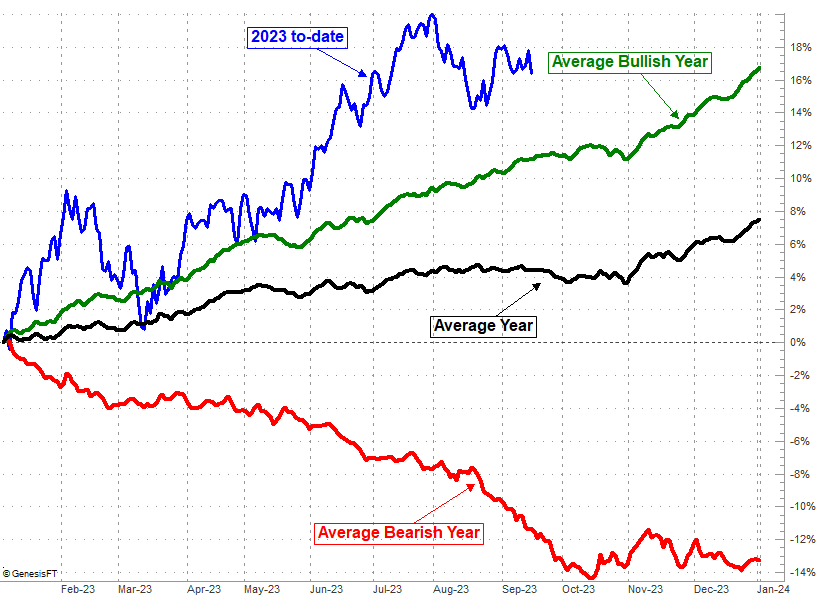
And yet, don’t panic too much of that’s the way things shape up. This is the time of year we’d expect that weakness, which tends to reverse course sometime between mid-October and mid-November… at the latest.
S&P 500 Average Full-Year (Day-by-Day) Performance
Source: TradeNavigator
Indeed, in some ways a little more scary selling here might be the best thing for the bulls, by virtue of clearing the proverbial decks so the market can easily dish out its usual year-end gains without any left over baggage or unfinished business.
For the time being though, stocks are mostly just caught between a rock and a hard place. Don’t be shocked if we don’t see much net movement this week, allowing indexes’ floors and ceiling to continue closing in.