Weekly Market Outlook – Stocks End The Year With a Whimper. Now What?

The market technically logged a ninth consecutive weekly gain during the final trading week of the year. But, it was the weakest gain of them all. It would be easy to assume the rally is running out of stream. And maybe it is.
Or, maybe traders were just elsewhere during the holiday-shortened week that was book-ended by three-day weekends.
Whatever the case, the overbought market could still start the new year out with a bullish bang, if only because the slate is cleaned. And if that’s not what’s in the cards, there’s still plenty of technical support below to bring a quick end to any selling effort. That’s the detail and nuance we’re most interested in seeing, if we’re going to see such a test in the coming week.
We’ll look at it in some detail in a moment. Let’s first look at last week’s biggest economic announcements and preview what’s in the lineup this week. There’s not a whole lot ahead, but there are a couple of whoppers.
Economic Data Analysis
There were only two data nuggets of interest posted last week, and they both reflected the same bigger trend. That’s home prices. On Tuesday we got October’s Case-Shiller home price index, as well as the FHFA’s measure of changing home values. Both were up -- again -- but the Case-Shiller index continues to indicate a clear slowdown in price growth. Anything less, and it would have been negative.
Home Price Index Charts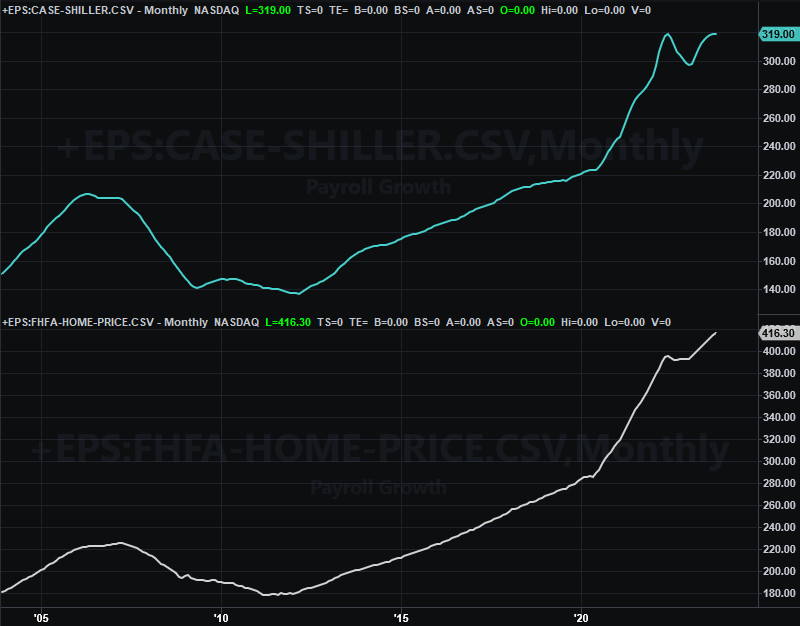
Source: FHFA, Standard & Poor’s, TradeStation
As was discussed last week, it’s easy to jump to the wrong conclusion based on housing price data alone. While the prices are seemingly still strong, the total number of houses being sold remans quite low. On the flipside, that number might be low largely because there’s still a relatively small amount of inventory available to buy.
The point is, just be sure to consider all the data.
Everything else is on the grid.
Economic Calendar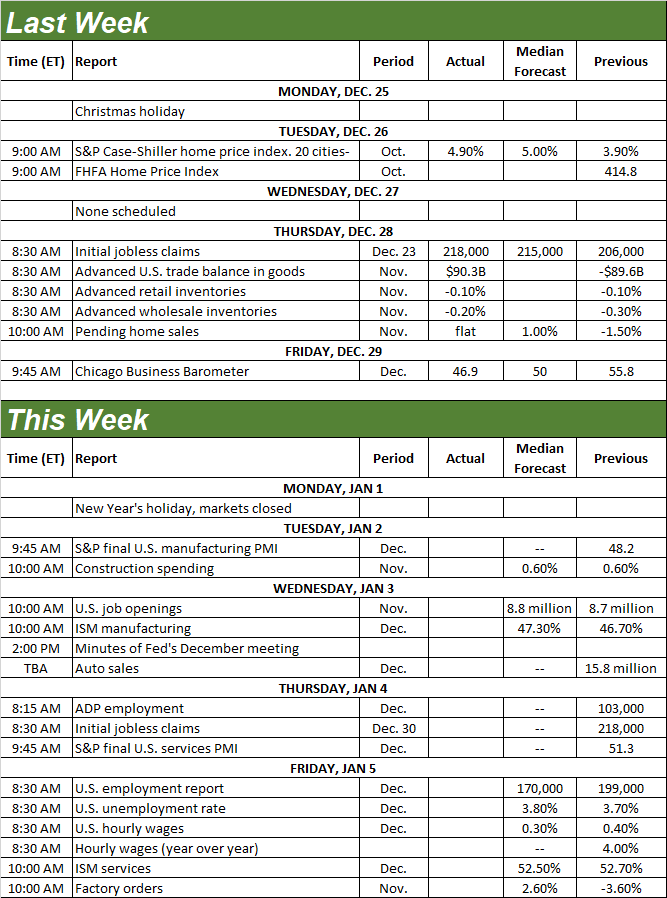
Source: Briefing.com
This week’s going to be a fairly light one again, although Friday’s jobs report could be raucous. Before we get those numbers, however, we’ll hear the Institute of Supply Management’s measure of the domestic economy’s strength. The ISM Manufacturing Index is coming on Wednesday, with the ISM Services Index report due on Friday. Manufacturing activity should be up a bit for December, but will remain below the pivotal 50 mark. Services activity will likely fall a hair, yet remains above the 50 level. This mixed message is about to get even more mixed. Even then though, it’s clear that both data sets are fighting off bigger-picture downtrends. That’s more bearish than not.
ISM Manufacturing, Service Index Charts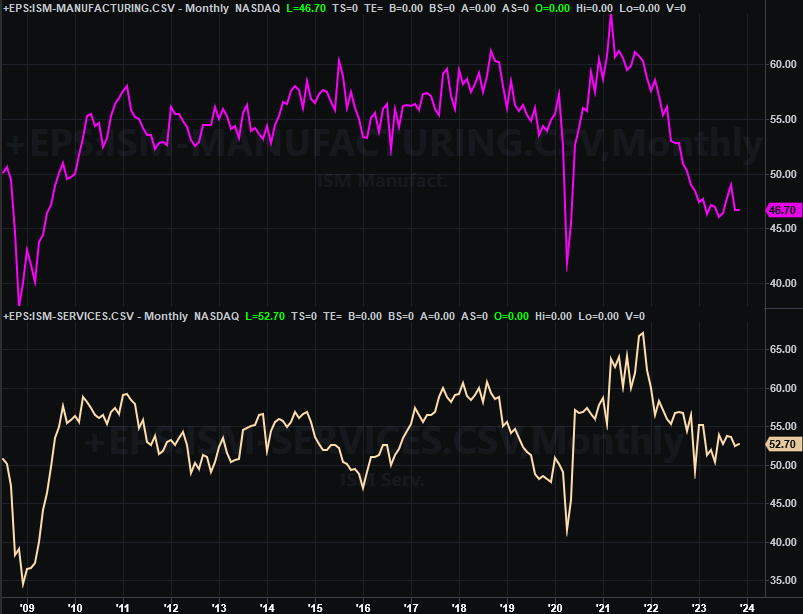
Source: Institute of Supply Management, TradeStation
Friday’s jobs report from the Department of Labor has the potential to move the market. Job growth is expected to slow a bit from November’s figure, which should be just enough to inch the unemployment rate up from 3.7% to 3.8%.
Payroll Growth, Unemployment Rate Charts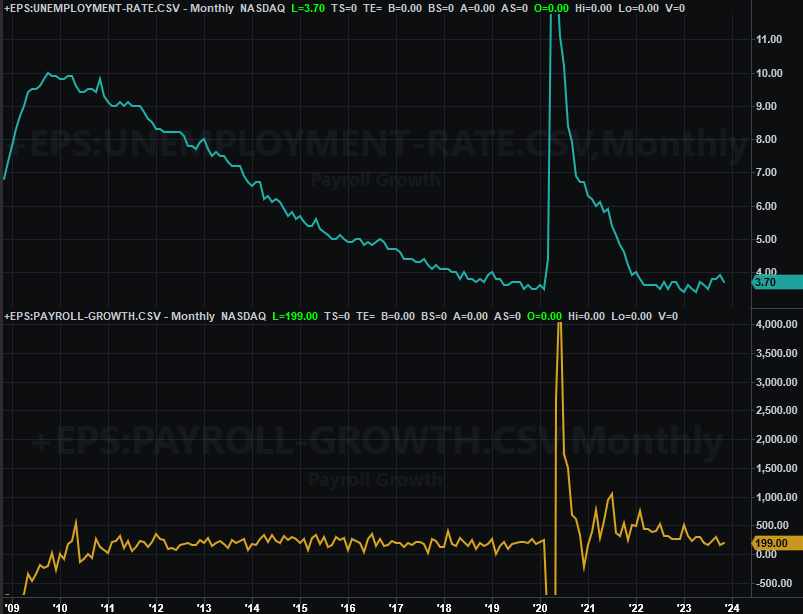
Source: U.S. Bureau of Labor Statistics, TradeStation
Don’t dismiss this data if that’s what we see take shape. The unemployment rate is starting to sneak higher, and the Federal Reserve predicts lethargic economic growth could crank the unemployment rate up to the low 4%’s in the coming year. You don’t want to suddenly wake up one day and unexpectedly realize there’s an economic headwind blowing.
Stock Market Index Analysis
Stocks got off to a good start last week, but didn’t end the week (and year) on a particularly high note. As the daily chart of the NASDAQ Composite below shows is, the index was losing ground by Thursday, and continued losing ground on Friday. Any more downside and the composite would have logged its first losing week in the past nine.
NASDAQ Composite Daily Chart, with VXN and Volume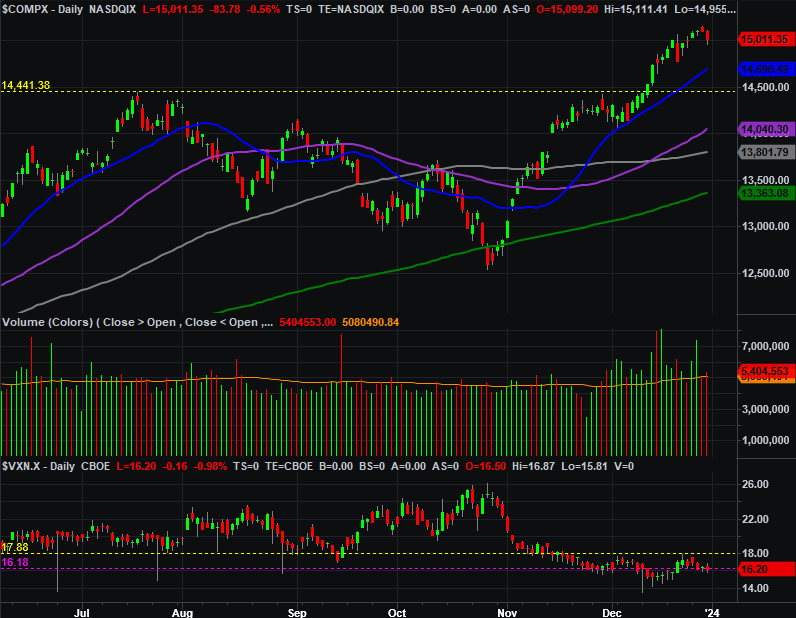
Source: TradeNavigator
Still, it’s not exactly the end of the world. The NASDAQ’s 20% runup from October’s low left it vulnerable to at least a little pushback. Waning interest in any trading at year-end (and in front of a three-day holiday weekend) set the stage for this lethargy. There was also plenty of incentive to close out trades before the end of the tax year, adding to the overall drag. The daily chart of the S&P 500 is showing us the exact same action.
S&P 500 Daily Chart, with VIX and Volume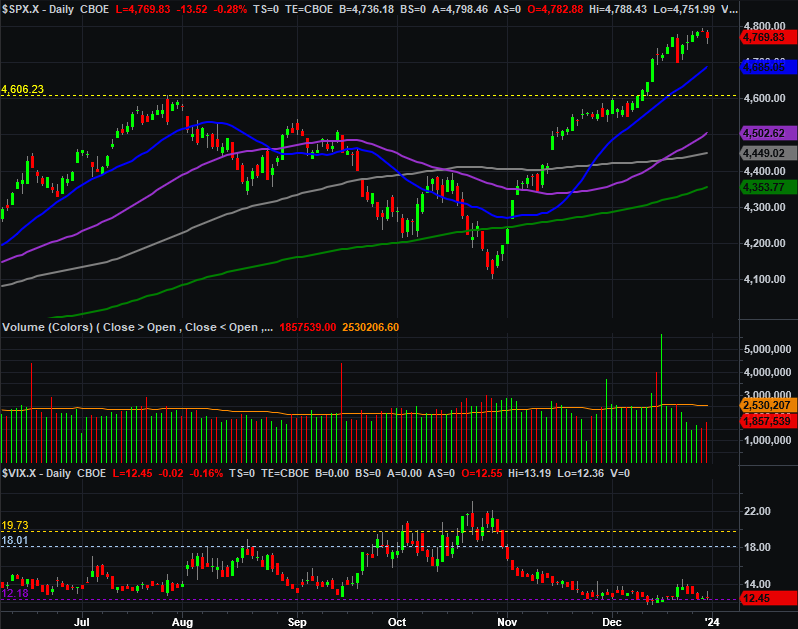
Source: TradeNavigator
Backing out to the weekly charts offers us considerably more perspective. As you can see on the weekly chart of the NASDAQ Composite below, the cup-and-handle breakout from three weeks ago is still intact. The rally that’s been underway for over two months now just needed a break. The technical thrust won’t be broken until the brim line at 14,440 is breached. (That being said, you’ll also want to keep a close eye on the NASDAQ’s 20-day moving average line currently at 14,690. It served as technical support in early December, establishing itself as an important floor to watch.)
NASDAQ Composite Weekly Chart, with VXN and Volume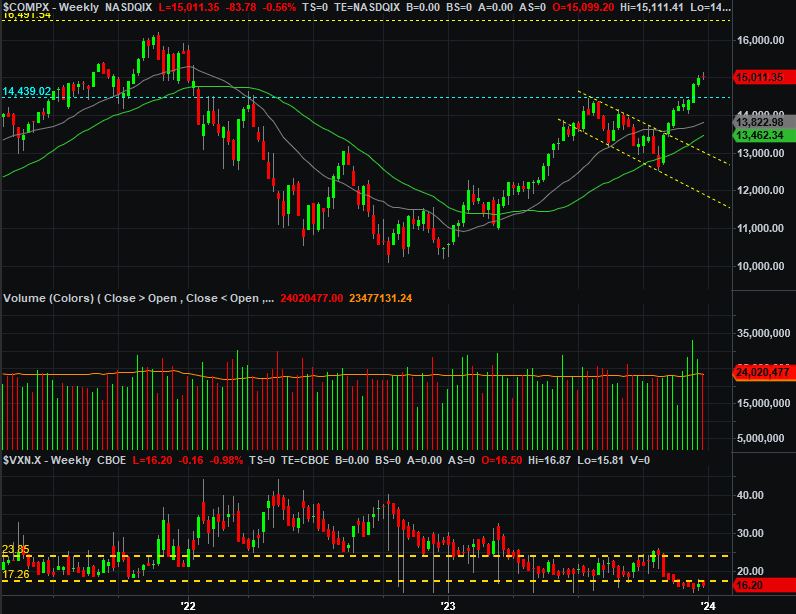
Source: TradeNavigator
It’s also worth noting -- and perhaps most importantly worth noting -- the S&P 500’s rally slowed down last week as its late-2021 peak came into closer view. Last week’s lethargy probably has more to do with timing and the calendar. It would be short-sighted, however, to ignore the possibility that traders aren’t psychologically ready to support moves beyond a major technical ceiling.
S&P 500 Weekly Chart, with VIX and Volume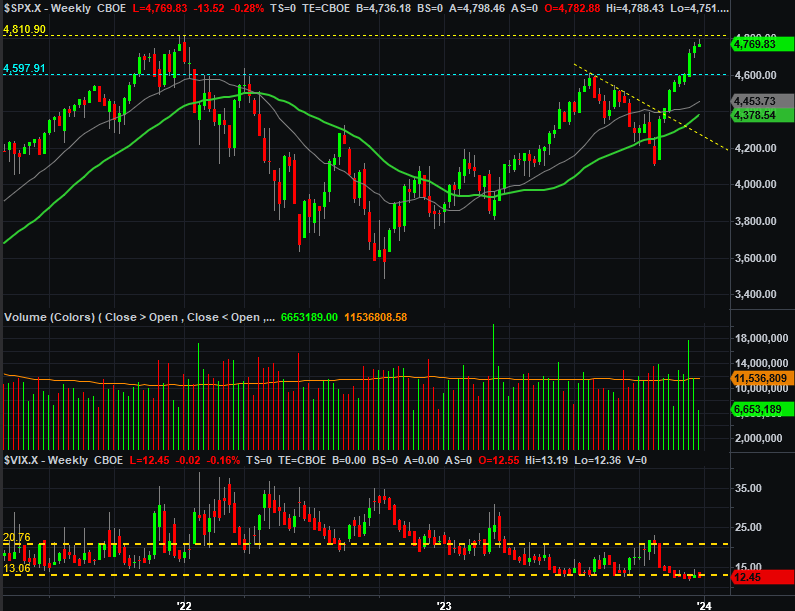
Source: TradeNavigator
The situation makes things tricky as we begin the new year. Stocks typically start the new year on a bullish foot. But, they’d be doing so this year at a disadvantage. That is, they’re already overbought and starting to struggle with the sheer weight of their gains. Or, it’s possible the usual bullishness seen during the first few days of the year will set up the correction that’s now overdue; the S&P 500 may only need to kiss its potential resistance at 4,811 to get that ball rolling.
The smart-money move right now may simply be doing nothing, and letting everyone else show their cards first as we begin 2024. The lines in the sand worth watching are pretty clear right now.