Weekly Market Outlook – Stocks End the Week on a High Note, Finally Punching Through Resistance
It was touch-and-go for the better part of last week, with stocks unable to break above long-established technical resistance. With a roaring start though, the market finally punched through on Friday. Now that it’s over this hump, the bulls have a much easier road ahead.
That doesn’t change the fact that stocks are still technically overbought and arguably overvalued. The rally would actually be better served by slowing its pace down to more sustainable levels. But, that’s not the hand we’ve just been dealt.
We’ll look at the matter in some detail in a moment. Let’s first look at last week’s top economic reports and preview what’s coming this week.
Economic Data Analysis
Last week’s biggest news of course was December’s retail sales report. They were once again good, and even better than expected. Moreover, most spending stratifications hit record annualized levels.
Retail Sales Charts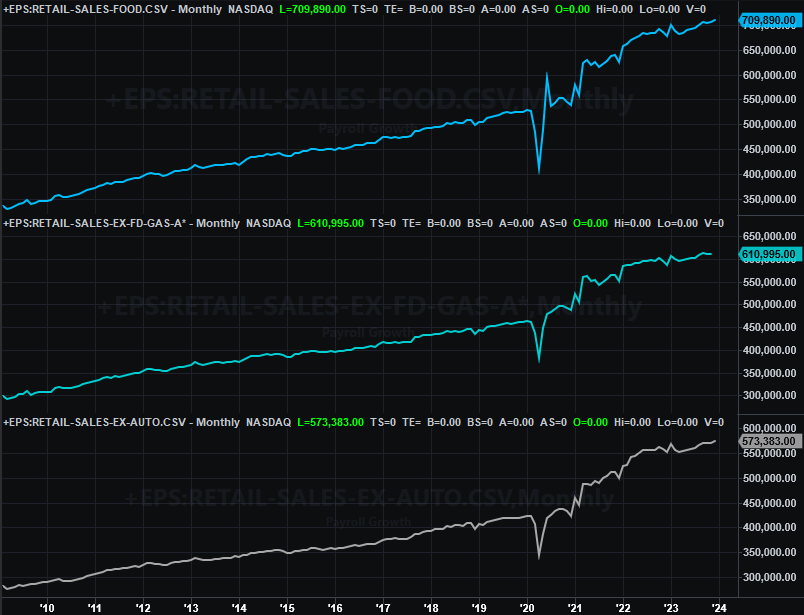
Source: Census Bureau, TradeStation
This is encouraging on the surface, but also a bit problematic. You may recall from last week’s look that inflation is starting to edge higher again. More retail spending suggests consumers will pay these higher prices. Both question the Federal Reserve’s tentative plans to cut interest rates later on this year.
The more troubling part is that little else from last week’s reports points to economic strength. Take last month’s capacity utilization and industrial production. Usage of capacity slipped to a multi-month low of 78.6%, and it’s not like industrial production is exactly firing on all cylinders either.
Industrial Production and Capacity Utilization Charts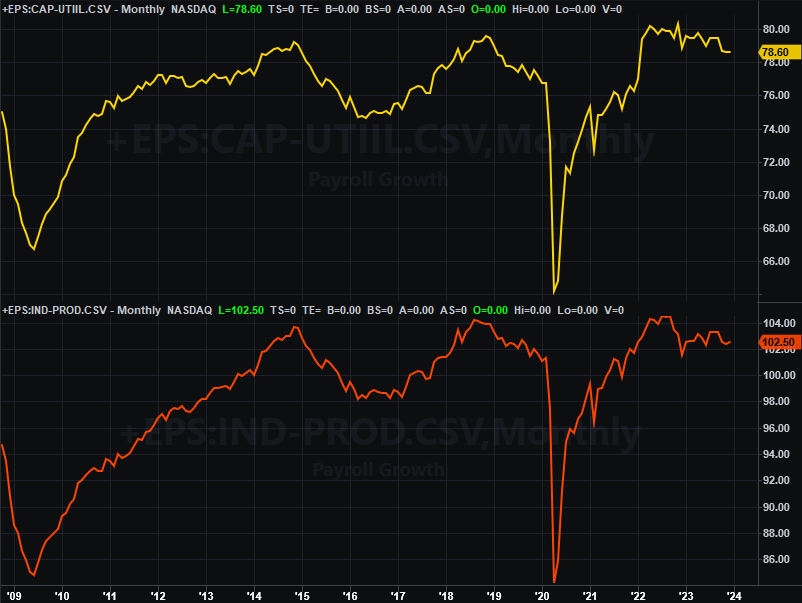
Source: Federal Reserve, TradeStation
This is a concern simply because the correlation between these two data sets and the long-term market trend is actually quite strong.
The real estate sliver of the economy remains lethargic as well. Last month’s housing starts fell from 1.53 million back to 1.46 million. Building permits are settling in at subdued levels as well.
Housing Starts and Building Permits Charts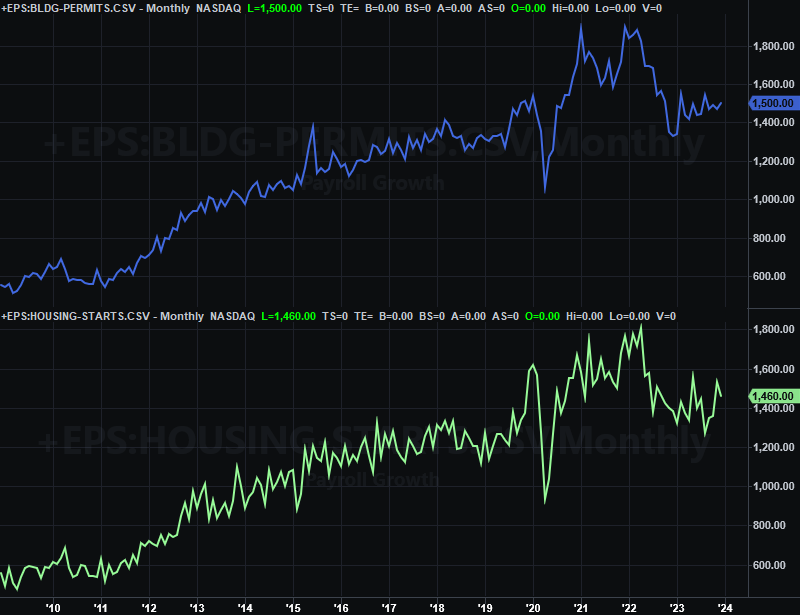
Source: Census Bureau, TradeStation
Curiously (but not shown), homebuilder confidence bounced to almost a full-year high for this month, with builders citing the recent drop in mortgage rates as being stimulative. In further contrast with this optimism is last week’s look at the most recent monthly sales of existing homes. They fell to a new multi-year low pace of 3.78 million in December, underscoring November’s sharp plunge in new-home sales. Prices might remain rather firm, but few homes are actually transacting at higher prices. Not much has actually changed about the housing market’s condition since then.
Home Sales Charts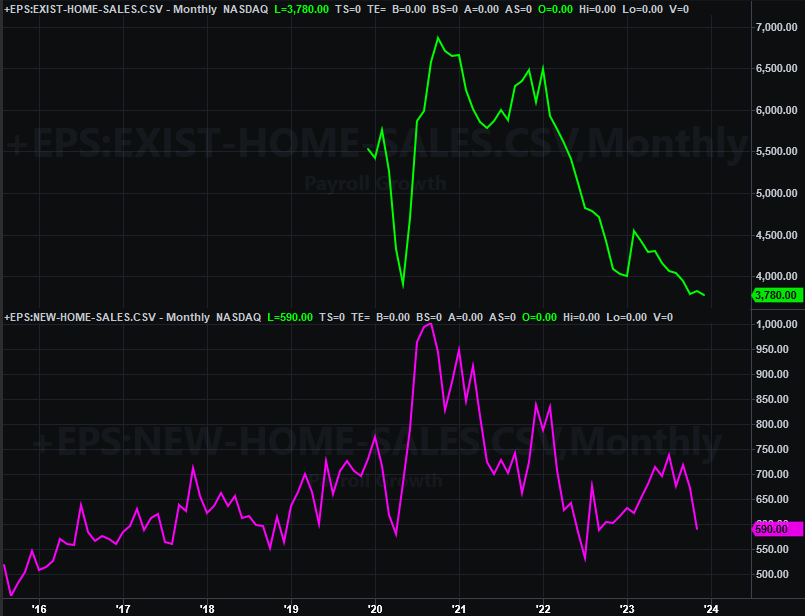
Source: Census Bureau, National Association of Realtors, TradeStation
Last month’s new home sales numbers will be posted this week. Forecasters are expecting a bit of progress on this front, if only because so many homeowners are sitting on their super-cheap mortgages.
Everything else is on the grid.
Economic Calendar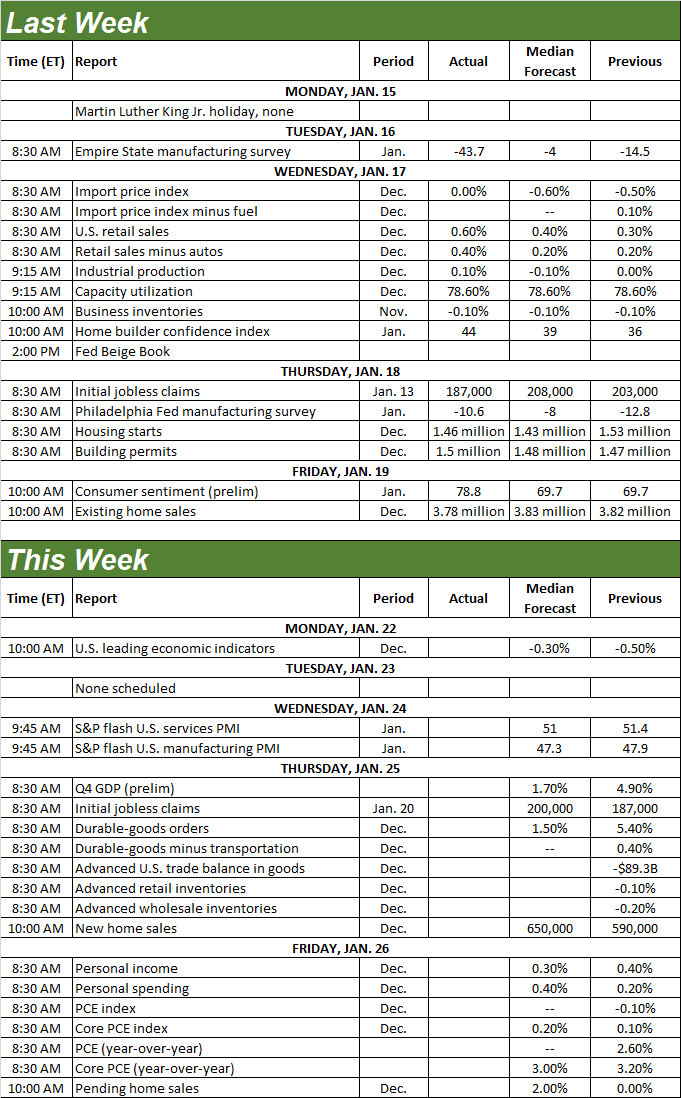
Source: Briefing.com
There’s not a ton of noteworthy data in the lineup this week, although the first look at last quarter’s GDP growth estimate is due on Friday, and with last month’s consumer earnings and expenditures coming on Friday.
Note the expected sharp slowdown in GDP growth isn’t quite as bad as it seems; Q3’s was abnormally high because it was in comparison to a very weak figure. Even so, coming up short of Q4’s low expectation could prove problematic.
As for Friday’s look at last month’s personal income and personal expenditures, you should know that this is the data the Fed considers first when making interest rate decisions. Both should remain firm, once again casting doubt on whispers of an interest rate cut within the next few weeks to months.
Stock Market Index Analysis
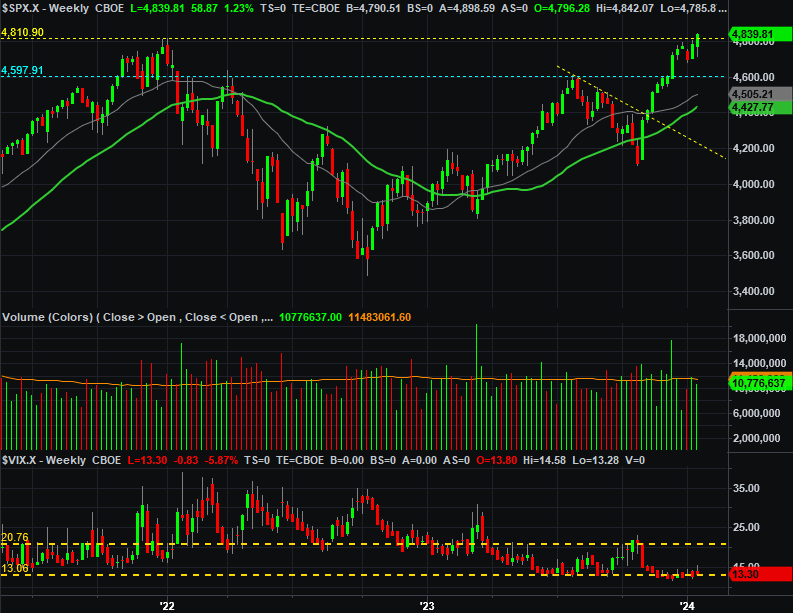
While the S&P 500 didn’t get last week started on a particularly bullish foot, it ended the week on one. Friday’s jump pushed the index above not only December’s and early-January’s high, but above the same resistance level hit all the way back in late-2021. As the weekly chart of the S&P 500 below illustrates, the index is now into record territory.
S&P 500 Weekly Chart, with VIX and Volume
Source: TradeNavigator
Here’s the daily chart of the S&P 500 for a little bit more detail. Notice the index is not only also back above its 20-day moving average line (blue) at 4,757, but it made the move on growing volume.
S&P 500 Daily Chart, with VIX and Volume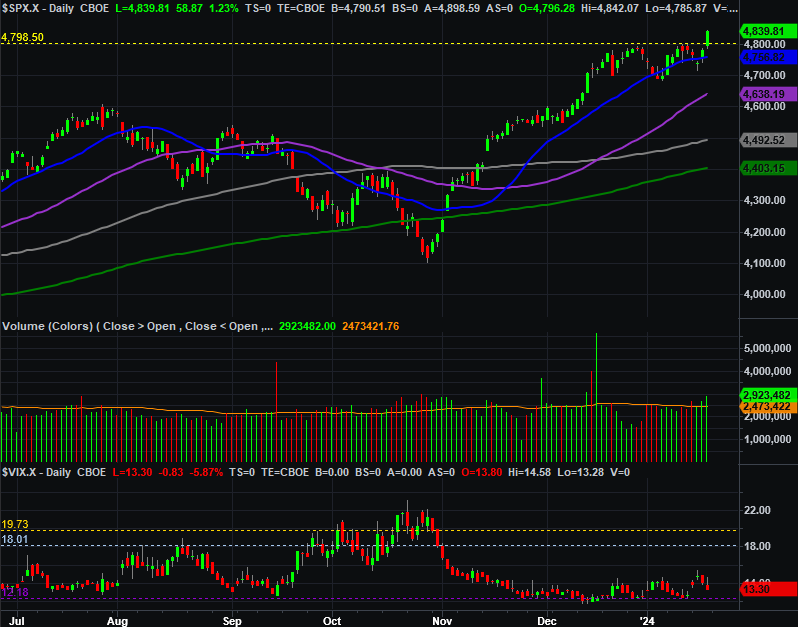
Source: TradeNavigator
Except, maybe it didn’t make the move on as much growing volume as there seems to be on the surface.
We mentioned last week that the market’s breadth (advancers versus decliners) and depth (up and down volume) has actually bean leaning in a bearish direction since the very last part of last year. As the comparison chart of all the breadth and depth data from the NYSE shows us, however, Friday’s surge was the only day where advancers were sharply higher than decliners, and where up volume was sharply higher than down volume. All trends start with that first thrust, but given that that the only decidedly bullish breadth and depth day -- paired with the fact that it was an expiration day -- we still don’t want to jump to conclusions despite the current momentum.
S&P 500 Versus NYSE Advancers/Decliners and Up/Down Volume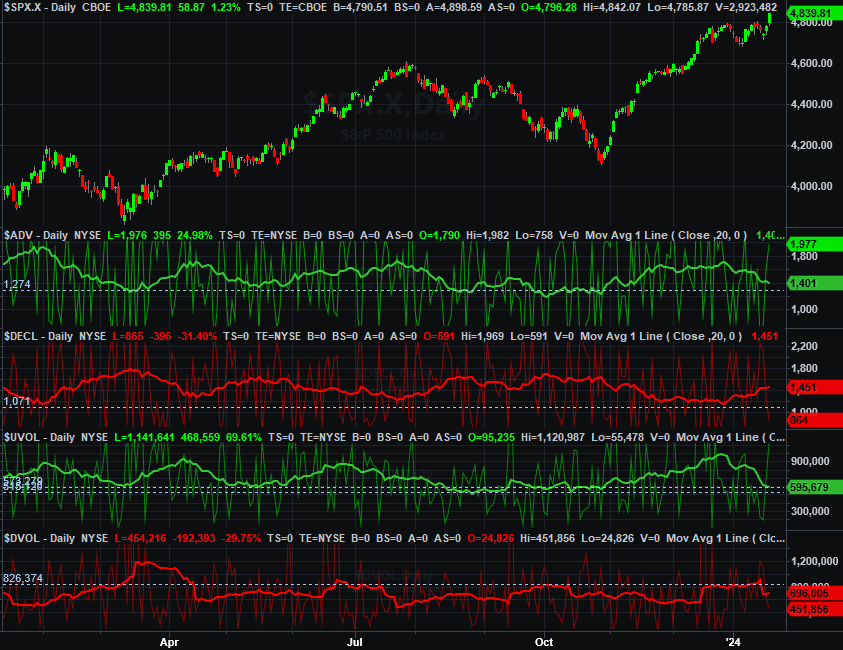
Source: TradeNavigator
Still, the net conclusion here is a bullish one. As the weekly chart of the S&P 500 above shows us as well as the weekly chart of the NASDAQ Composite below does, we’re still benefiting from the cup-and-handle pattern that first started to take shape all the way back in early 2022… the pattern that turned bullish by breaking above the brim line six weeks ago. It just so happens that the composite continues to trail the S&P 500, when it would ideally be leading the charge.
NASDAQ Composite Weekly Chart, with VXN and Volume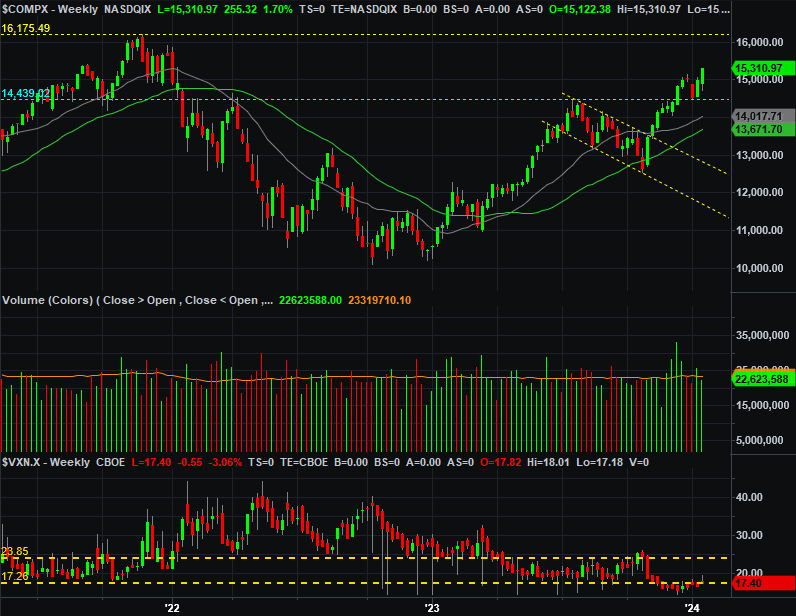
Source: TradeNavigator
We have to be bullish here based on the market’s current momentum. But, this is a very cautious bullishness just given how far stocks have climbed over the past twelve weeks. It’s still ripe for profit-taking even if it’s still relatively healthy in the bigger picture. A slight lull here might still be the best thing to keep the advance going.
The next noteworthy milestone is the NASDAQ’s 16,175 level, where it topped in late 2021.