Stocks managed to log their third winning week in a row last week, and in so doing are (mostly) above all the major technical ceilings that could have stopped the rally effort. Yes, from a trend-trading perspective, this is bullish.
Too good for our own good? Maybe. Certainly stocks ended last week on an unusually-high note, setting the stage for some profit-taking as the new week gets going. Don't read too much into that if that's what we see as this week gets going though. There's room for a little bit of pullback without snapping the uptrend.
We'll look at it in detail below. First though, let's recap last week's top economic news and look at what's coming this week.
Economic Data Analysis
As was expected, home prices continued to dwindle through January... although perhaps not as dramatically as feared. The Case-Shiller Home Price Index's pullback is shallowing, while the FHFA Housing Price Index is... clearly no longer rising. But, it's not plunging anymore either.
Home Price Charts
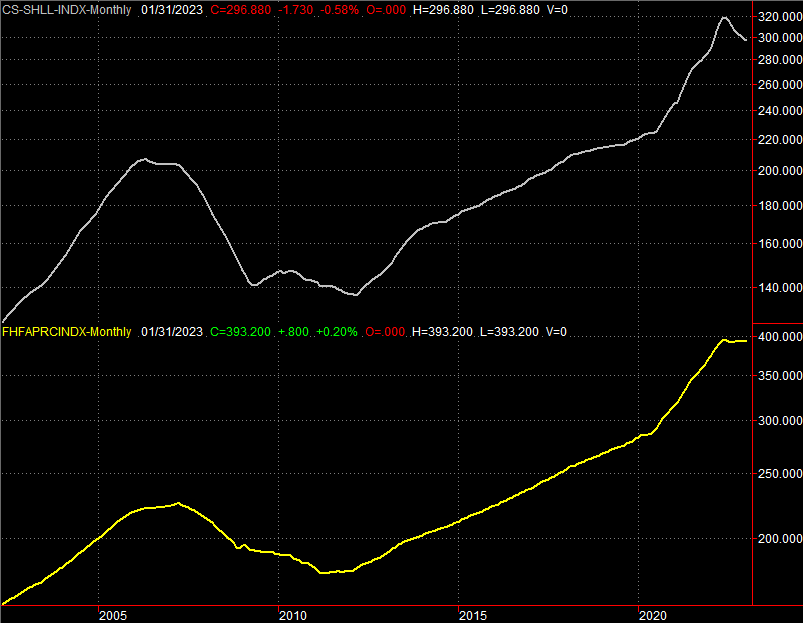
Source: Standard & Poor's, FHFA, TradeStation
It's not relief. Home prices may have ticked higher a couple months ago in response to a surge in buying meant to capitalize on a brief lull in interest rates. Rates aren't remarkably higher now, but nobody knew that would be the case then. Broadly speaking, home prices are still poised to fall, and the economy's poised to let them.
Sentiment also continues to be a bit of a liability. The Conference Board's consumer confidence measure was essentially flat for March, while the University of Michigan's sentiment index fell measurably. And, both indexes are still at subpar levels.... with room to fall further (although note that February's pending home sales ticked a little higher versus calls for a sizeable dip). It's definitely a mixed message.
Consumer Sentiment Charts
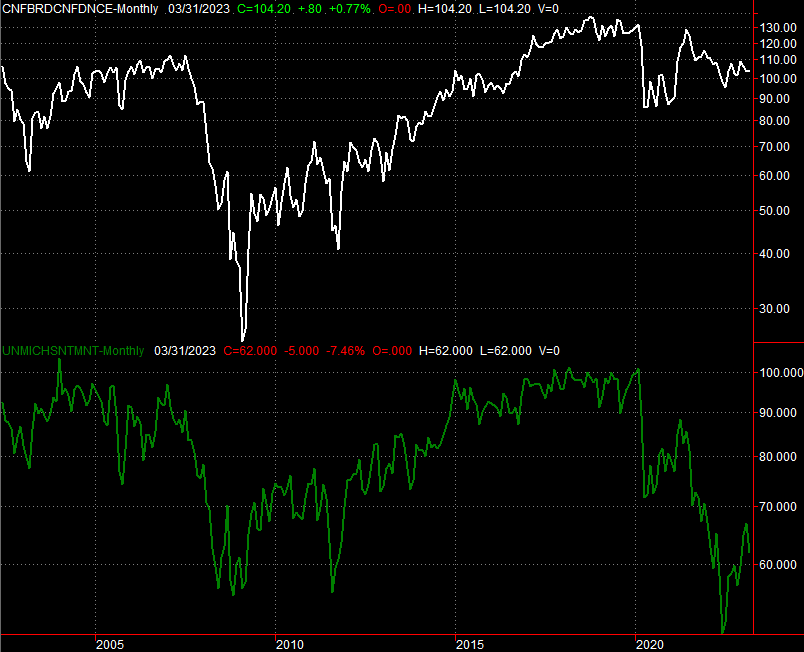
Source: Conference Board, University of Michigan, TradeStation
There's no chart of it, but note that the third estimate of Q4's GDP growth rate came in at 2.6%, down slightly from the previous guess of 2.7%. Either is a lackluster number, although perhaps a lackluster GDP print will help curb inflation.
Everything else is on the grid.
Economic Calendar
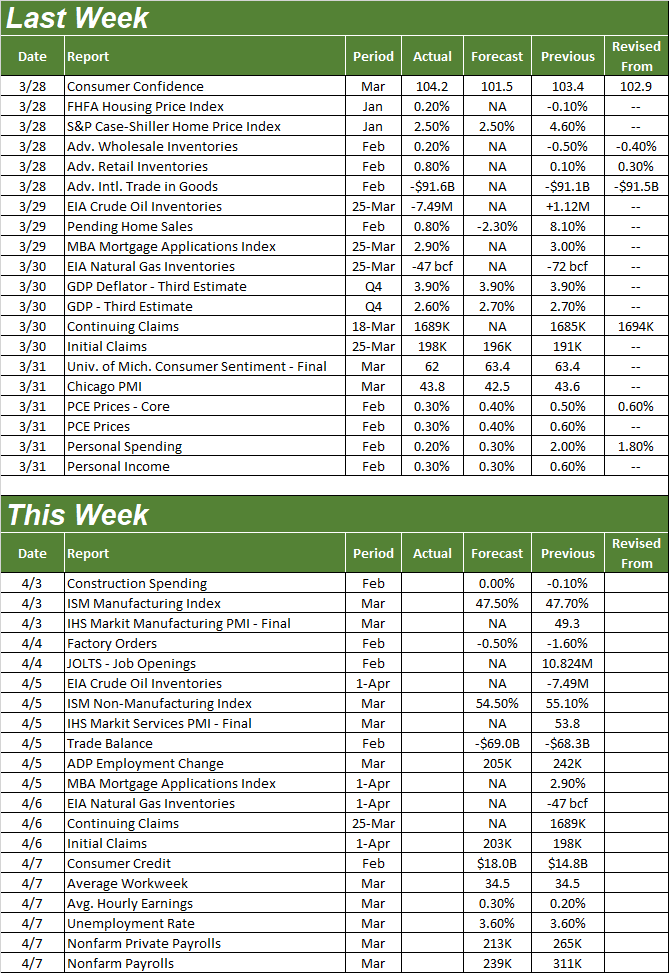
Source: Briefing.com
This week's set to be a busy one, but there's only two data sets we're interested in.
The first one is March's ISM data. The ISM Manufacturing Index is likely to fall just a bit when it's reported on Monday, while Wednesday's ISM Services Index data is expected to fall a bit as well. But, at least the services version of the ISM's economic barometers is still above the critical 50 mark that points to economic growth.
ISM Services, Manufacturing Index Charts
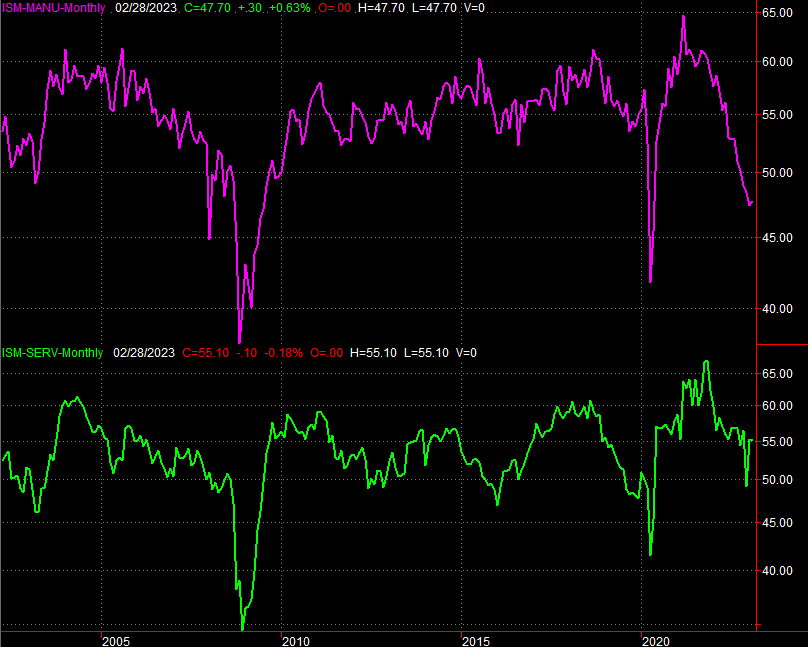
Source: Institute of Supply Management, TradeStation
On Friday we'll hear last month's jobs report. Economists are calling for the net addition of 239,000 jobs, down slightly from February's figure of 311,000. But, with the unemployment rate likely to hold at 3.6%, there's just not a lot of room or need for bigger payroll growth numbers.
Payroll Growth, Unemployment Rate Charts
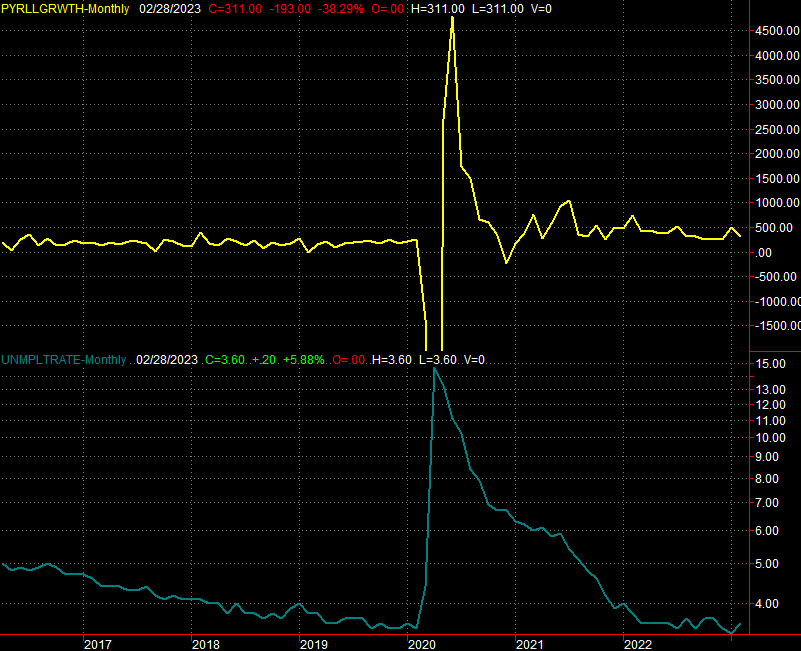
Source: Bureau of Labor Statistics, TradeStation
Stock Market Index Analysis
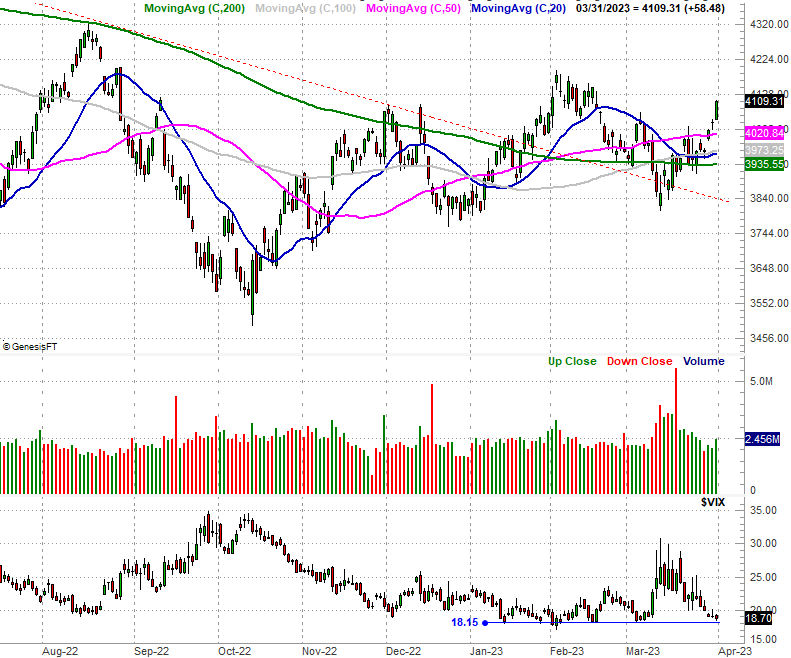
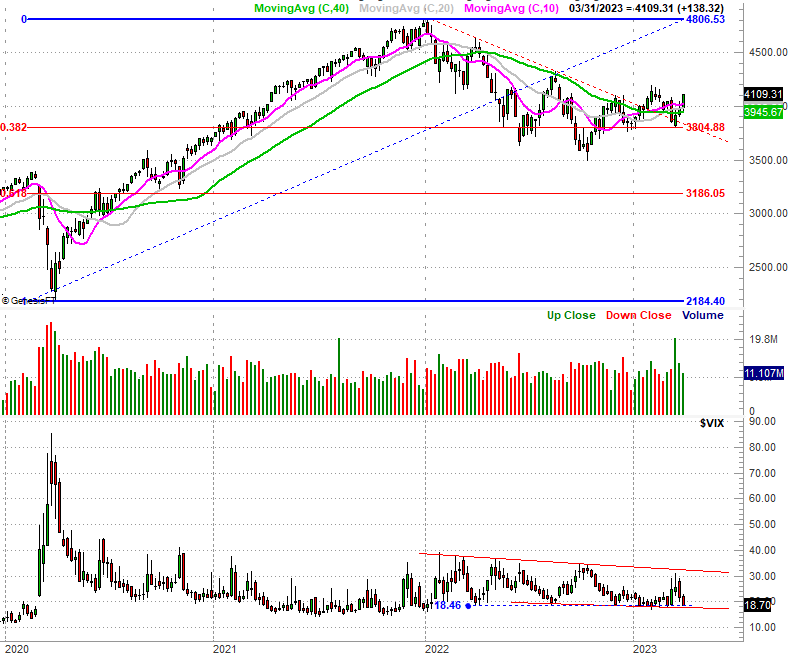
We start this week out with a look at the daily chart of the S&P 500. It speaks for itself. In the span of just five trading days the index pushed above all of its key moving average lines to log its best close since late February. There's not much left above that could provide technical resistance now, although it's arguable the S&P 500 traveled too far too fast last week, setting the stage for some profit-taking. Just don't flinch if that's how we start this week. There's room for a modest pullback.
S&P 500 Daily Chart, with VIX and Volume
Source: TradeNavigator
Bolstering the short-term bearish argument is the way the S&P 500's Volatility Index (VIX) is bumping into a horizontal floor right around 18.0. The weekly chart of the S&P 500 indicates the VIX is now touching a couple different layers of support, which suggests investors' lack of fear is nearing a dangerous proportion.
S&P 500 Weekly Chart, with VIX and Volume
Source: TradeNavigator
Still, there's no denying the S&P 500's back in breakout mode. It's interesting and noteworthy that the reversal that took shape three weeks ago happened right at the 38.2% Fibonacci retracement line at 3805. That's where you'd expect such a turn to materialize.
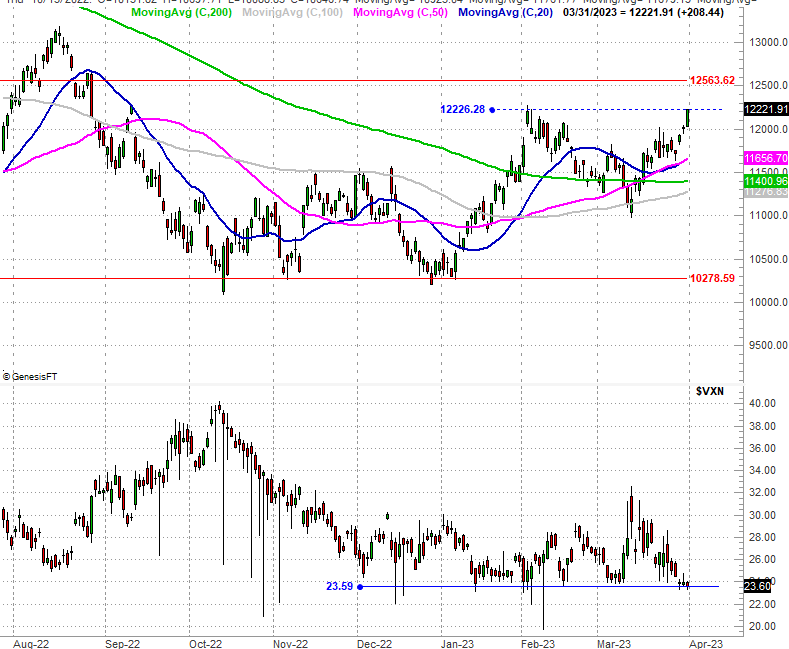
The NASDAQ Composite is ripping higher as well, closing at its highest close since September of last year. Sure, it too is overbought and ripe for profit-taking, particularly given high last week's high looks almost perfectly aligned with the peak from early February. Just don't panic if that what we see from here. Like the S&P 500, there's room for a little bit of selling without snapping the uptrend.
NASDAQ Composite Daily Chart, with VXN
Source: TradeNavigator
The most notable feature of the daily chart is more evident on the weekly chart of the NASDAQ Composite below. That's the bullish convergence (crossovers) of all the composite's moving average lines reversing the bearish convergence -- followed by a bearish divergence -- from early last year. All of these bullish crosses of these moving averages just within the past two months indicates a shift in momentum. Also note that all four key moving average lines are now sloped upward, underscoring this bullish momentum that got started with a touch of the 61.8% Fibonacci retracement line at 10,279.
NASDAQ Composite Weekly Chart, with VXN
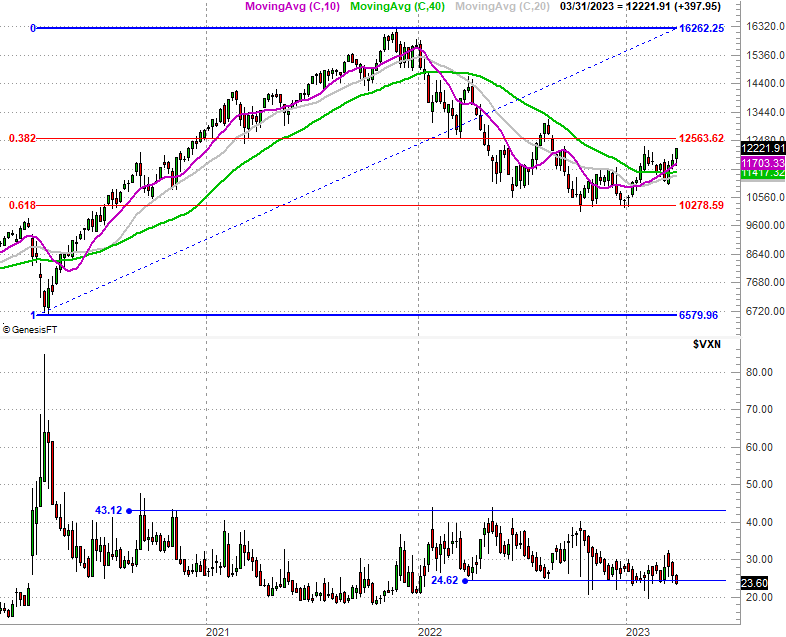
Source: TradeNavigator
The risks to this rally? As is the case with the S&P 500's volatility index, the NASDAQ's Volatility Index (VXN) looks like it could struggle to move any lower, finding a floor around 24.6. There might also be trouble at the NASDAQ's other Fibonacci line at 12,563.
The bottom line is, however, the tide is bullish. It's the bears that are going to have to prove they're capable of stopping the bullish effort that's now underway. Just remember a little bit of pushback this week isn't going to do that.