
Another week, another win. That’s the fourth one in a row, further cementing this unlikely rally into place. Better still, the NASDAQ as well as the S&P 500 both cleared major technical hurdles, pushing them into territory where there’s no past history to hold them back.
Perfect? No, there are some lingering concerns. A lack of volume behind the effort remains the biggest one. It’s manageable though. Now the bulls just need to deal with another bullish gap left behind by Wednesday’s strong open. We’ll see how that goes. It’s possible for that gap to get filled in without destroying the rally.
We’ll look at everything in some detail in a moment. Let’s first look at last week’s wave of economic reports and preview what’s due this week.
Spoiler alert: Despite the market’s continued strength, the economy isn’t exactly strong here. Traders are just counting on economic lethargy to inspire interest rate cuts. That’s not exactly a great bet to be making at this time though.
Economic Data Analysis
It could have been worse. But, it could have been better as well. The economy is clearly starting to run into a headwind.
The party started on Tuesday, with last month’s producer inflation report. Consumer inflation data was released on Wednesday. In both cases it remains above-target, and is holding steady at current levels rather than inching lower. In fact, some stratifications are suggesting price increases are on the rise again. The Federal Reserve can’t be too aggressive with its aim of pushing interest rates lower.
Producer and Consumer Inflation Charts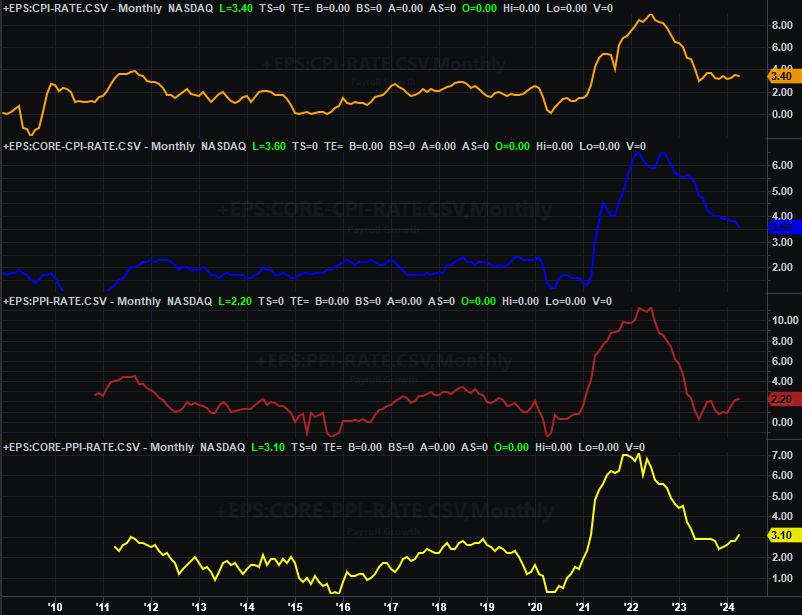
Source: Bureau of Labor Statistics, TradeStation
Also on Wednesday we got April’s retail sales reports. They were… ok. They’re clearly not meaningfully growing any longer though. They also fell short of expectations. This is another sign that consumers (and therefore the economy) are finally running out of gas thanks to the drag of inflation.
Retail Sales Charts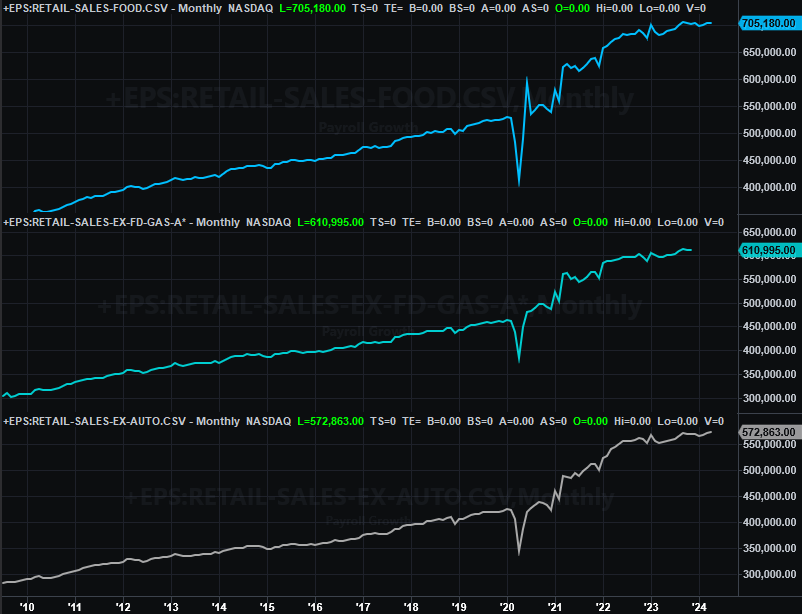
Source: Census Bureau, TradeStation
On Thursday we heard last month’s housing starts and building permits. Economists weren’t look for any real progress from March’s weak levels, and they didn’t even get that. Starts of 1.36 million and permits of 1.44 million both came up short of expectations, but more than that, permits and starts remain are relatively low levels. High interest rates continue to hold demand for new homes down. This fact can’t be escaped.
Housing Starts and Building Permits Charts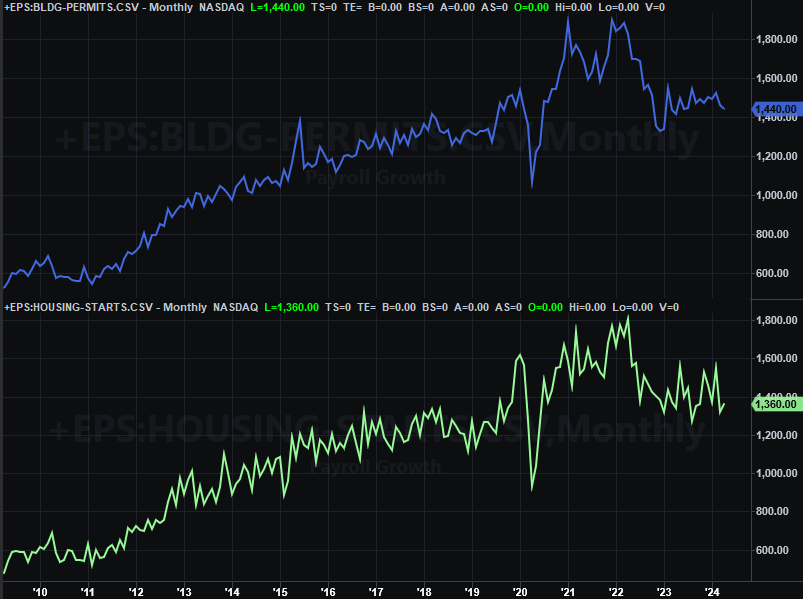
Source: Census Bureau, TradeStation
Finally, also on Thursday we got April’s capacity utilization and industrial productivity figures from the Fed. Utilization rates continued to slide, while the budding rebound in productivity has already started to peter out. Both also came up a little short of forecasts.
Capacity Utilization and Industrial Productivity Index Charts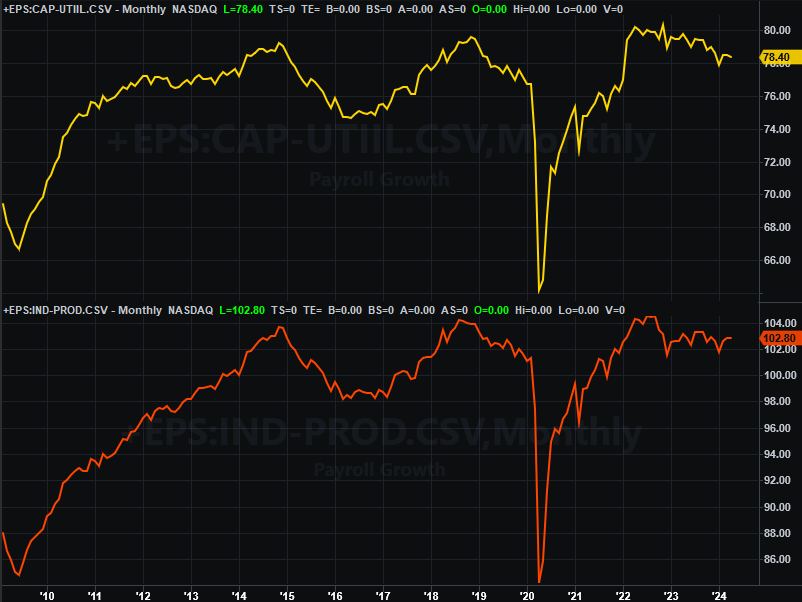
Source: Federal Reserve, TradeStation
This is no small problem. The industrial activity and usage of capacity data strongly correlates with corporate earnings. Profits are still generally edging higher, but that can’t persist forever while these two economic barometers are showing weakness.
Economic Calendar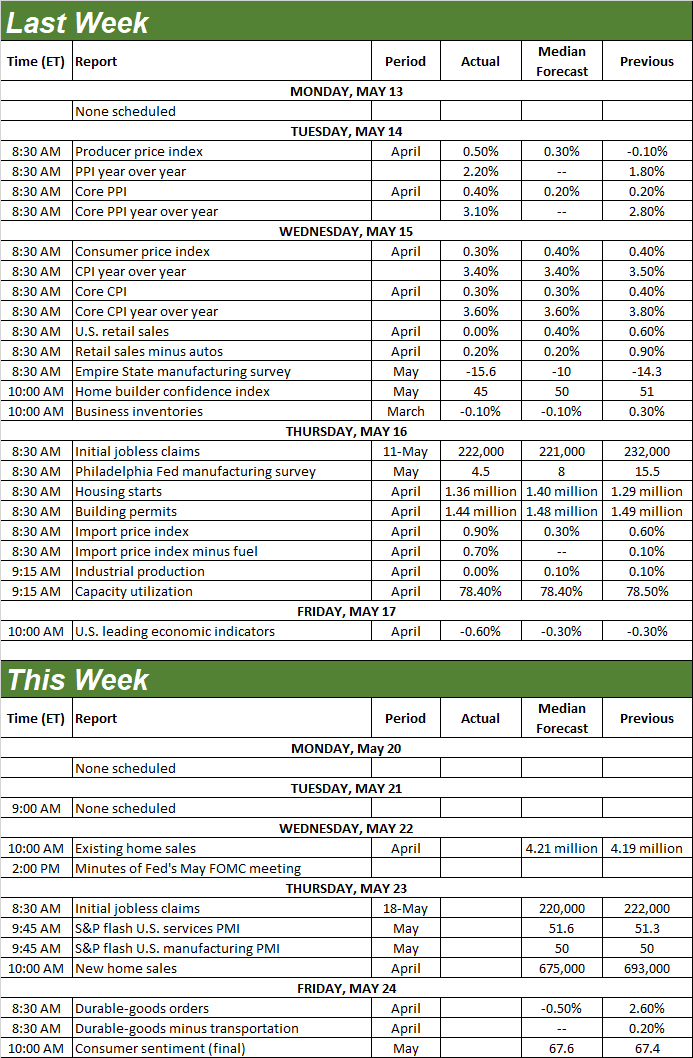
Source: Briefing.com
This week’s going to round out the real estate picture, with April’s sales of existing homes due on Wednesday and new home sales figures scheduled for Thursday. Both are expected to fall just a bit. That’s trouble on both fronts though, and particularly for sales of existing homes; people really are interested in staying put while interest rates as well as home prices are frothy.
New, Existing Home Sales Charts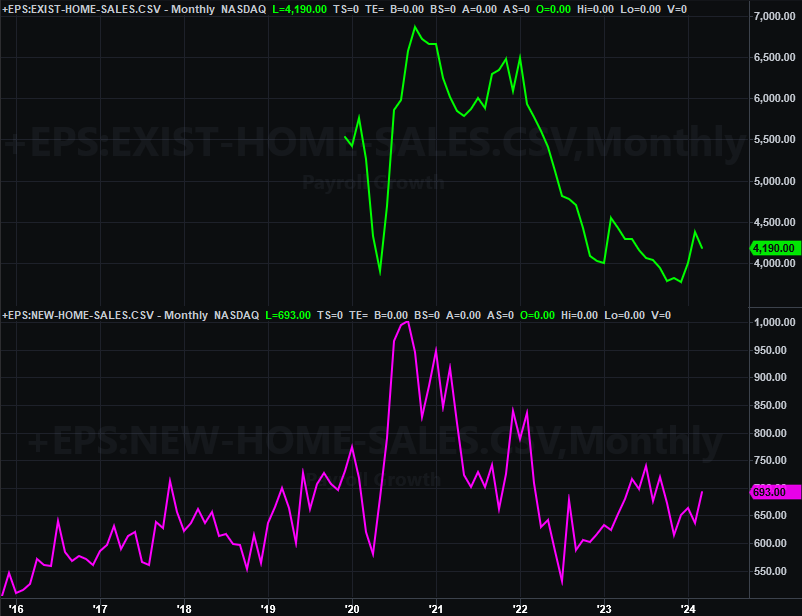
Source: National Assn. of Realtors, Census Bureau, TradeStation
Finally, on Friday look for the third and final reading of the University of Michigan’s sentiment index for May. While not shown on our chart, you may recall the previous estimate of 67.4 was a six-month low. That’s not apt to change much from here, leaving the indicator at that six-month low. As is the case with industrial activity, too much low confidence for too long will eventually catch up with stocks.
Consumer Sentiment Charts
Source: University of Michigan, Conference Board, TradeStation
The Conference Board’s consumer confidence score for May will be released next week. Don’t look for any relief from it then either.
Stock Market Index Analysis
It did it! It didn’t happen the way the bulls wanted it to happen, but last week, the stock market hurdled an important resistance level, hitting record highs as a result.
For the S&P 500, that level was 5,274 (white, dashed), where the index topped out in late March. On Wednesday of last week, the S&P 500 broke past that mark to close at 5,303.27 on Friday, capping off a 1.5% gain for the week. The index is now up 6.9% for the past four weeks.
the market itself to continue climbing higher.
S&P 500 Daily Chart, with VIX and Volume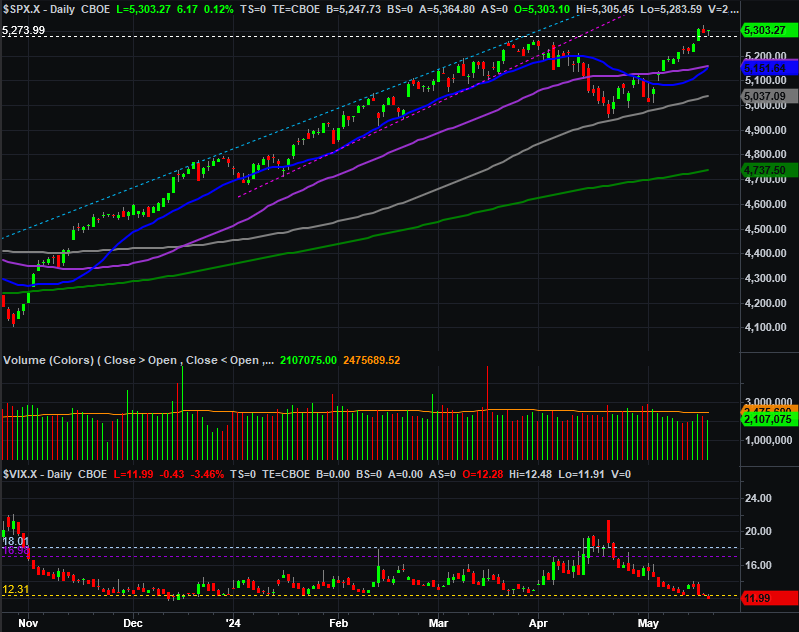
Source: TradeNavigator
Still, it’s not the ideal thrust. The S&P 500 left behind a small cap at Wednesday’s open, which still remains unfilled. Now there are two unfilled opening gaps; the previous one is from May 3rd. The Volatility Index (VIX) is also back to its absolute floor near 12 (yellow, dashed). This doesn’t innately mean the S&P 500 must now peel back. But, it does at least make it tougher for the market to continue rallying.
Here's the weekly chart of the S&P 500 for a little more perspective. You can see the break above the 5,274 line from this vantage point, although the chief reason we’re looking at this timeframe is to remind you we’re still in the wake of a cup-and-handle pattern that first began taking shape in early 2022, and was only completed in December of last year when the index broke above the brim line at 4,600.
S&P 500 Weekly Chart, with VIX and MACD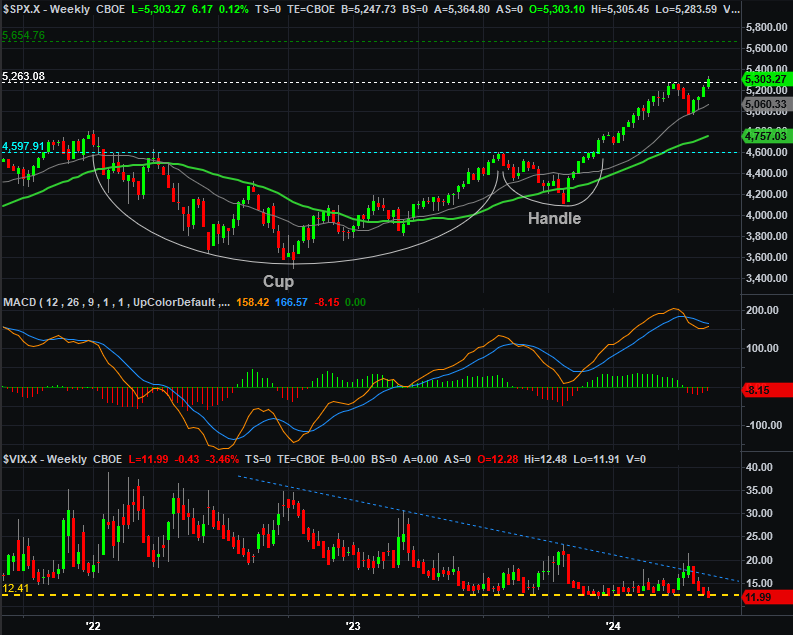
Source: TradeNavigator
The assumption behind cup-and-handle breakouts is that the distance traveled following the breakout will more or less be the same span from the bottom of the “cup” to the brim of the cup. That’s a little over 1,000 points, which -- in theory anyway -- would push the S&P 500 up to 5,655 when all is said and done.
It’s just a theory, of course, but one worth keeping in mind. As impossible as that prospect may seem right now, that wouldn’t be unlike the move from October’s low to March’s high. And so far, the rally has proven surprisingly resilient.
The NASDAQ Composite achieved the same feat. That is, it broke out above March’s peak near 14,600 (white, dashed) on Wednesday. That’s bullish. Problem? It too left behind a gap on Wednesday, which is the second one as well. Its previous one can also be found on May 3rd.
NASDAQ Composite Daily Chart, with VXN and Volume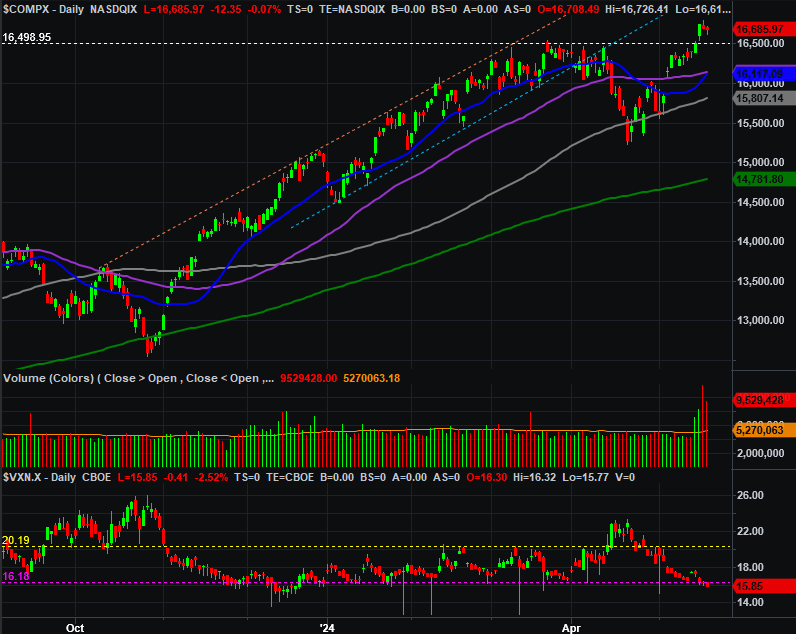
Source: TradeNavigator
So what’s up with the NASDAQ’s swell of volume? Although the S&P 500 didn’t mirror it, the composite’s volume surge mostly stems from the fact that last Friday was an option expiration week, drawing a lot of trading action that would have otherwise not been done. It’s not a meaningful clue, and odds are good we’ll start to see normal volume levels again at the onset of this week.
Here’s the weekly chart of the NASDAQ Composite. The only detail this view adds is a big one. That is, in early 2023 and then between October of last year and March of this year, the NASDAQ made two strong, uninterrupted advances following pullbacks similar to the one the composite made between late-March and early April. Don’t assume something similar can’t happen again here and now. This prospect of course aligns with the cup-and-handle clue.
NASDAQ Composite Weekly Chart, with MACD and Volume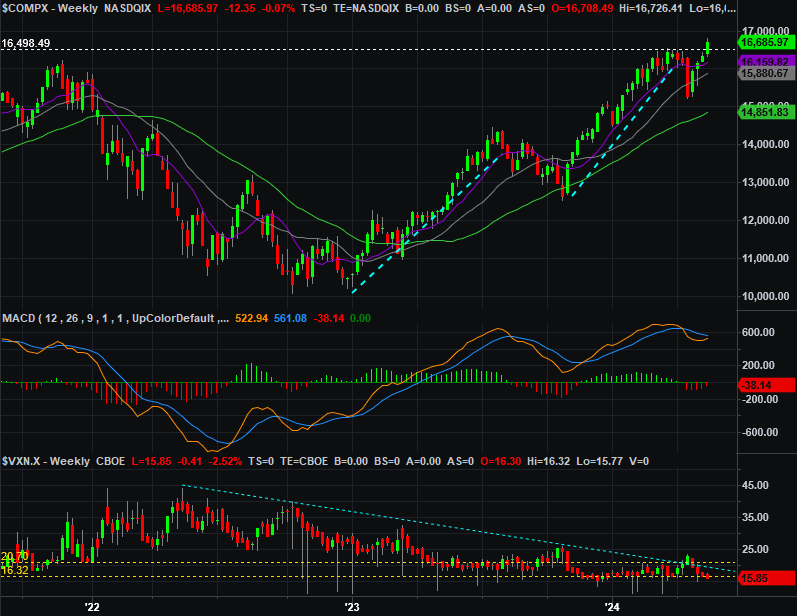
Source: TradeNavigator
Bolstering the bullish case at this time is the simple fact that there aren’t any obvious and intact bearish technical clues.