Weekly Market Outlook - One Bullish Nudge Away From a Breakout
 Last week began a bit wobbly, with stocks dropping hints that they would fail to follow through on the prior week's strength. For the S&P 500, that meant a stall just shy of a record high. After the Department of Labor shared last month's job report on Friday though -- and the House of Representatives approved an Obamacare replacement plan -- the buyers were stoked again. Friday's late gain left the S&P 500 right on the cusp of a move into new-high territory.
A tease, only to make traders think a breakout is imminent before lowering the proverbial boom? Maybe. Or, maybe we should take the clues at face value and be ready to jump on board the bullish train.
We'll look at both sides of the coin below, after running down last week's and this week's economic news.
Economic Data
It was the last piece of economic news we heard last week, but it was also the most important piece.... April's jobs report. We'll start there with this review, pointing out the 211,000 new payrolls added last month was not only better than the expected 180,000, it was enough to move the unemployment rate dial to 4.4%.
Unemployment Rate and Job Growth Charts
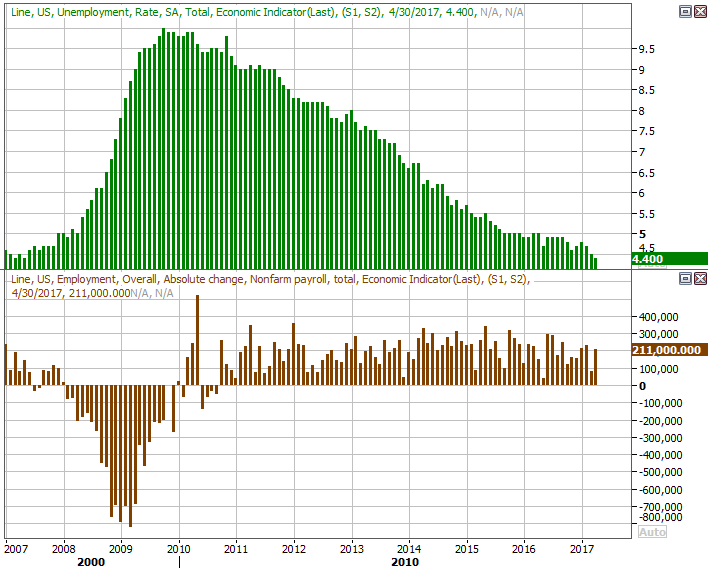
Source: Thomson Reuters
It was legitimate progress too -- not just fortuitous math. Though still not great, with wages also going up for a second month in a row, we're inching our way to incomes that drive meaningful GDP growth. (We took a closer look at the whole unemployment picture at the website, right here.)
We also heard about April's ISM data last week. Though overall it was good, those figures were mixed relative to expectations. The ISM Services Index topped expectations, and the ISM Manufacturing Index fell short. Either way, both are above the key 50 level.
ISM Index (Service and Manufacturing) Charts
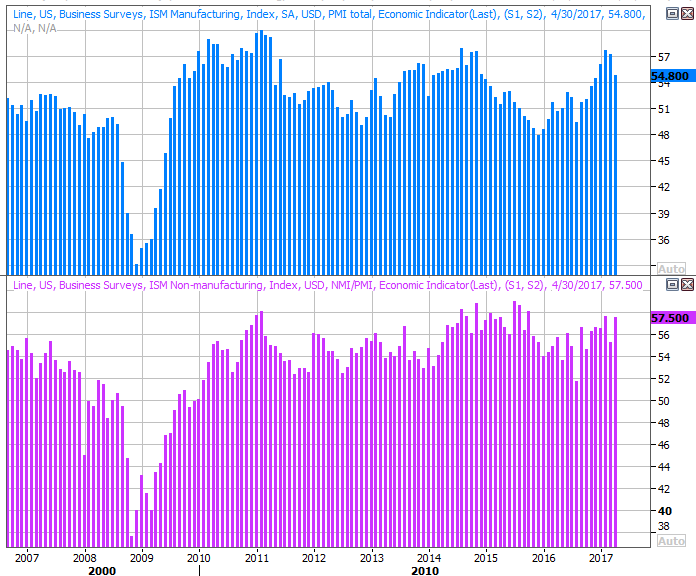
Source: Thomson Reuters
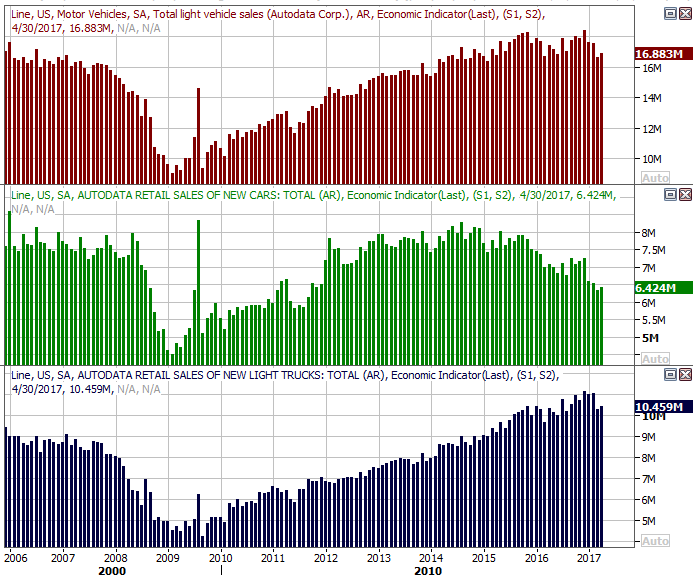
April's auto sales pace also fell.... again, for the fourth month in a row. The present annualized pace is now 16.88 million units versus last year's total of 17.5 million. Passenger car sales continued a long-term slide, and truck sales -- which had been propping the industry up -- have started to cool.
Auto Sales (Total, Cars, Trucks) Charts
Source: Thomson Reuters
We also explored the automobile sales landscape in depth at the website.
Everything else is on the grid.
Economic Calendar
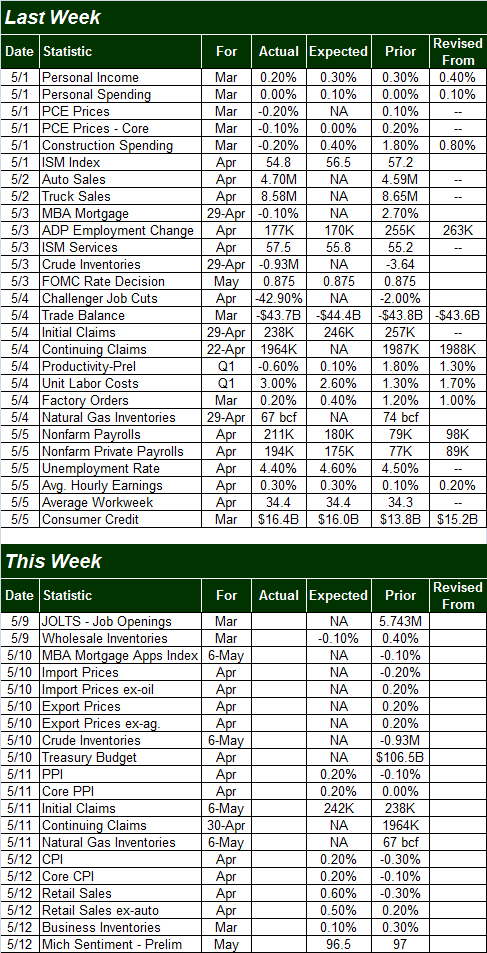
Source: Briefing.com
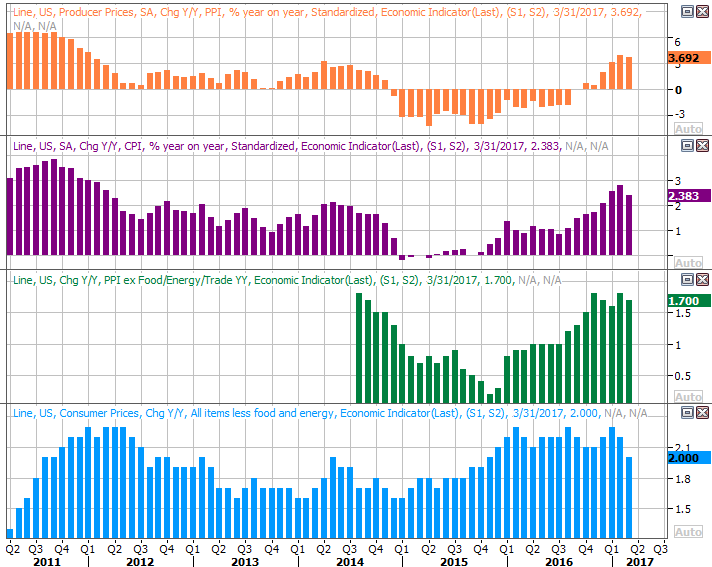
This week isn't going to be quite as busy, but there are a couple of noteworthy announcements in the queue. One of the big ones to watch for is the inflation update -- consumer and producer. The latter will be posted on Friday, and the former on Thursday. Economists are looking for a 0.2% increase in prices for both, on a core and non-core basis. That should leave all rates somewhere around 2% across the board, which in turn means the Federal Reserve has room and reason to ratchet interest rates up again in June, when it will have its next scheduled chance to do so.
Producer and Consumer Inflation (Annualized) Charts
Source: Thomson Reuters
Last week, comments from Janet Yellen acknowledge that the first quarter's economic growth was lackluster. Don't read too much into that pessimism though. Remember, the trajectory is as important (if not more important than) the average data, and March's and April's economic data point to a rekindled economy. The FOMC is arguably interested in keeping a lid on inflation before it soars. To that end, the market has already priced in a 78% chance of a rate hike next month.
The other item to keep an eye on this week is April's retail sales. That report is due on Friday. The pros think we'll see pretty solid growth, reversing a surprising lull in retail consumption in March. Given the wage increases and job growth we've seen in the meantime, it wouldn't be surprising to reach those healthy targets.
Retail Sales Growth (Annualized) Charts

Source: Thomson Reuters
Consumers have certainly done their part to keep the economy propped up of late. The weak link has mostly been business spending/consumption.
Index Analysis
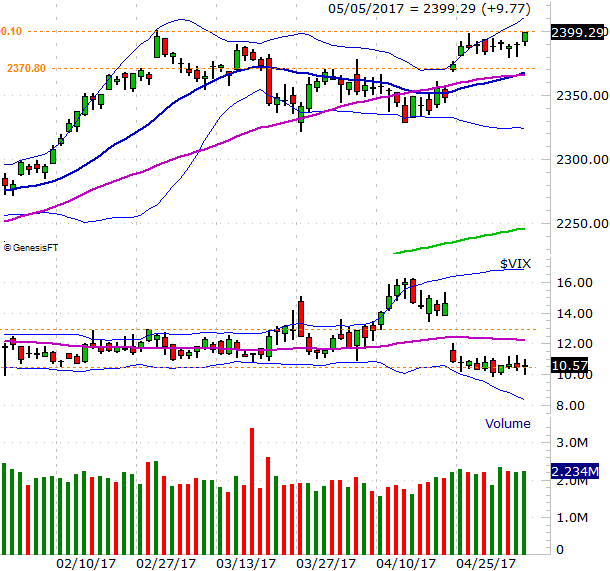
Monday is sure to be an interesting day. Ditto for every other day this week. Stocks are on the cusp of record highs. One good nudge would get the S&P 500 over a key technical hump. On the other hand, the situation is less than ideal for starting another rally leg. A big gap from two weeks ago remains unfilled, and the VIX is at multi-year lows... again. There's just not a lot of room for more upside.
S&P 500 Daily Chart
Chart created with TradeNavigator
On the other hand, that's been the case more than once lately, and it hasn't necessarily stopped the bulls. Don't get so bogged down by what should be happening that you look past what is happening. If the market is willing to push the S&P 500 past its recent ceiling at 2400, then so be it. Just don't turn a blind eye to the rally. It could fade quickly too,
That said, a different look at the S&P 500 reveals things are perhaps more bullish than they may feel like they should be.
Take a look at the S&P 500 with its MACD and PercentR indicators. Momentum was already bullish, but was fully rekindled on Friday. And, with the PercentR line above 80 AND with the S&P 500 on the verge of new highs, that full-blown buy signal is on the verge of materializing. It will be complete when/if the index actually moves above the 2401 level. That could mark the beginning of the aforementioned meltup, though again, you can't necessarily count on that strength lasting for a meaningful amount of time.
S&P 500 Daily Chart, with PercentR and MACD Indicators

Chart created with TradeNavigator
The daily chart of the NASDAQ Composite looks a little different than that of the S&P 500, although the underlying assessment is the same. That is, the undertow is technically bullish, but it's difficult to believe there's room for more upside. Nevertheless, a move above last week's resistance level of 6101 would be exciting enough to inspire another round of buying. Again though, don't assume it's going to last indefinitely.
NASDAQ Composite Daily Chart
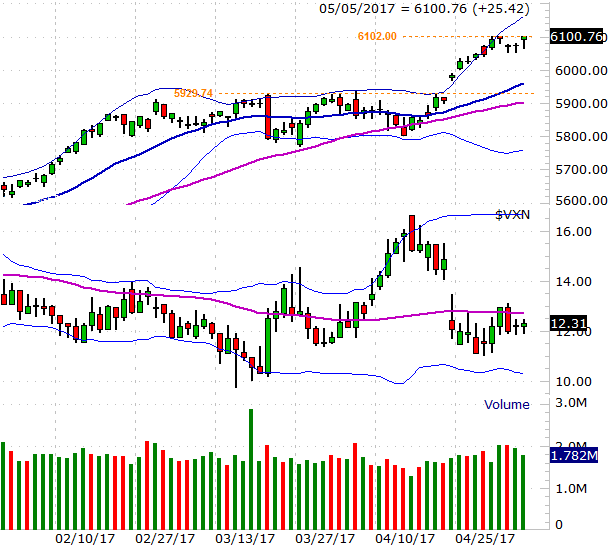
Chart created with TradeNavigator
Zooming out to a weekly chart of the S&P 500 doesn't add much to the mix, though in this timeframe we can see the VIX is now at the bottom edge of a long-term wedge. That once again bolsters the case that the VIX is due to rise, which ultimately works against the market.
S&P 500 Weekly Chart
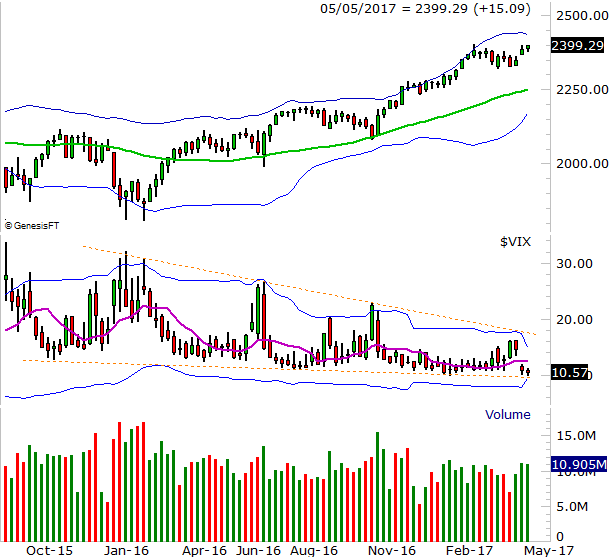
Chart created with TradeNavigator
There is one distinct point of interest we have in the weekly chart of the S&P 500's weekly chart, however. That is, the importance of the Bollinger bands wrapped around the index and the VIX as well. We've got a feeling they're going to play a role in starting and stopping the ebbs and flows. If the S&P 500 does surge, its upper band currently at 2436 could put a cap on it. And, should the VIX finally break above its upper band line, it would be the first time in years it's happened. If we see that, look at below. More than a year's worth of pent-up profit-taking could be unleashed.