Weekly Market Outlook - Momentum Wins Again, But Again, It's Flimsy Momentum
 It was touch and go for the better part of the week, but against just the right backdrop of news and with just the right amount of FOMO (fear of missing out), the bulls were willing to plow into stocks late in the last trading day of the week. The S&P 500 even managed to reach a new record; the NASDAQ had already done so a few weeks back.
Just for the record though, it's still a flawed rally effort. The volume behind the advance is not only below-average, it's sinking. Most investors are wary of buying in now. They're just not willing to take profits yet either.
We'll examine the matter in some detail below, after a run-down of this week's and next week's economic news.
Economic Data
Last week was modest in terms of economic announcements, but the bit we got wasn't exactly thrilling.
Most disappointing was July's new and existing home sales figures. They weren't bad, but they were far from the shot in the arm the bulls would have liked to have seen. Existing home sales fell from June's pace of 5.38 million to 5.34 million, and sales of new homes fell to an annualized rate of only 627,000 units. The tepid numbers extend a slow downtrend in activity that's becoming a little uncomfortable.
New and Existing Home Sales Charts
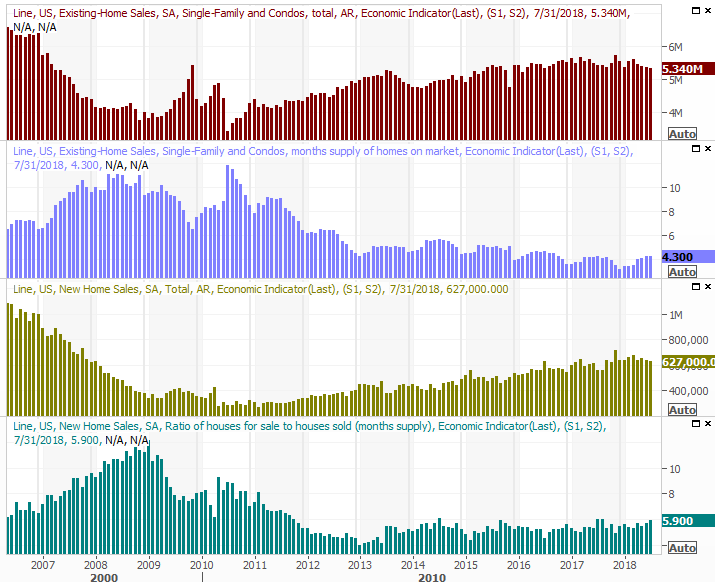
Source: Thomson Reuters
Home prices inched a little higher, crude inventory levels fell, and durable goods orders didn't improve quite as much as anticipated.
The big news, of course, wasn't the release of economic data per se, but the release of the minutes from the most recent FOMC meeting. In short, the Fed anticipates ongoing economic strength, forcing it to remain on pace with its plans to raise interest rates as this year turns into next year. The minutes also went as far to say, though, that the body does indeed believe that a prolonged tariff war could take a toll on economic growth.
Everything else is on the grid.
Economic Calendar
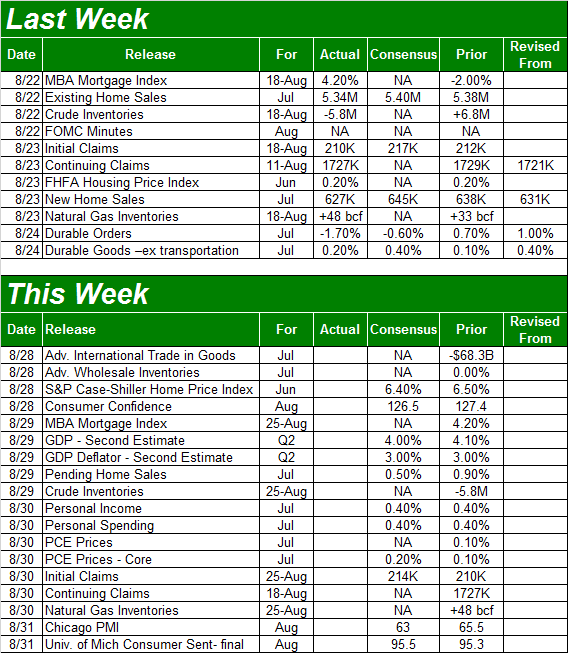
Source: Briefing.com
This week's going to be a bit busier, although not much of it is terribly hard hitting. The first item of interest will be Tuesday's Case-Shiller Home Price report. This isn't an item we've dissected too often, primarily because it's not wavered from its uptrend in years. It's starting to slow though... a turn made all the more alarming by the fact that home purchase activity is also slowing. Ditto for the FHFA Housing Price Index, which was updated last week.
Home Price Charts
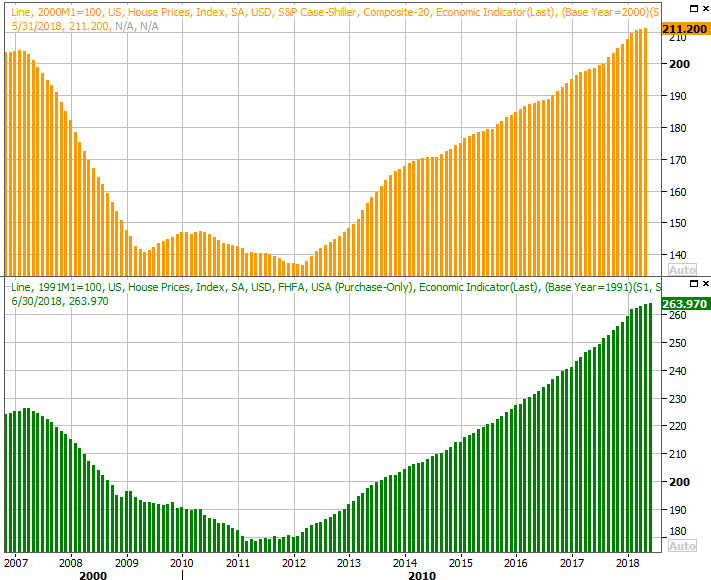
Source: Thomson Reuters
Both data sets are for June, not July, so it's possible the current pace of home price change is actually even worse than it seems on the surface.
On Wednesday we'll get the second (of three) estimates for Q2's GDP growth rate. The early guesses pegged it at 4.1%, and economists aren't looking for that to change. If its 4.1% this time around, it will almost certainly be 4.1% when the third and final reading is taken next month. Even if it comes up short though, anything near 4.0% is phenomenal.
GDP Growth Rate Charts
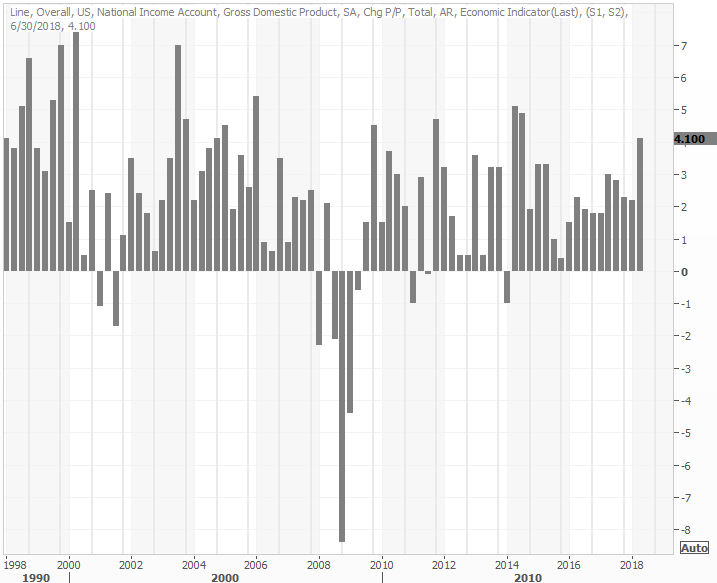
Source: Thomson Reuters
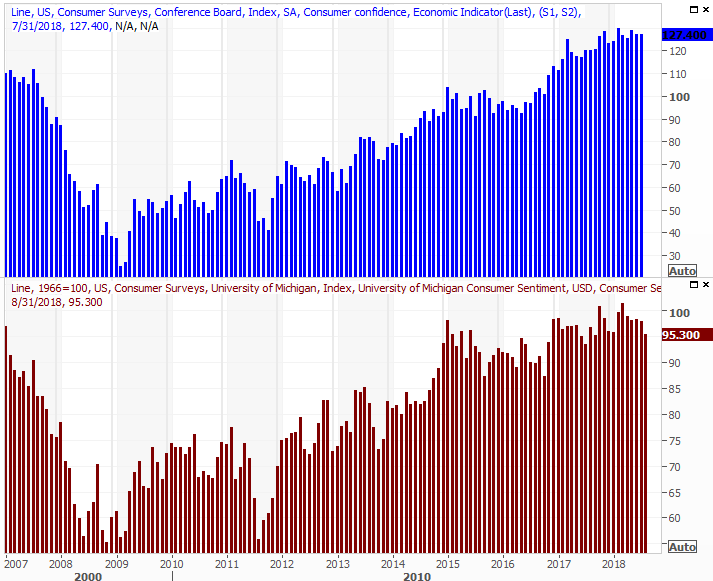
Perhaps the biggest news in the queue this week, however, is a look at August's consumer confidence scores. The third and final reading for the University of Michigan Consumer Sentiment measure will be posted on Friday, and the Conference Board's read on Consumer Confidence will be posted on Tuesday.
Both are still on broad uptrends, but it's difficult to say that both aren't slowing down.
Consumer Sentiment Charts
Source: Thomson Reuters
It may not entirely matter. The situation is relatively unusual in that sentiment tends to peak around current levels in step with an economic peak. We're not seeing any evidence of an economic peak though, leading to one big question - does sentiment have an absolute ceiling? If we're at it, the sentiment trends may stagnate, but that doesn't mean the bull market has to end here.
Only time will answer that question.
Index Analysis
This is the kind of scenario that forces traders to choose between two paths, neither of which they really want to take.
On the one hand, we have to follow the momentum because... well, it's momentum. On the flipside, no one can deny stocks are overbought and ripe for a reversal. The S&P 500 is up a little more than 12% from its early April low, and in retrospect, the January-through-April lull was only an 11% tumble. That's not a bad sized correction; in normal circumstances that could be enough to hit the market's "reset" button. The dip didn't start with normal circumstances though.
The S&P 500 was already well into an unfettered bull trend as of November, but rallied a whopping 10.5% from mid-November to mid-January. All told, the S&P 500 advanced nearly 39% from November of 2016 to January of this year. The 11% slide from January's peak doesn't exactly count as the capitulation we needed. The weekly chart of the S&P 500 below puts things in perspective.
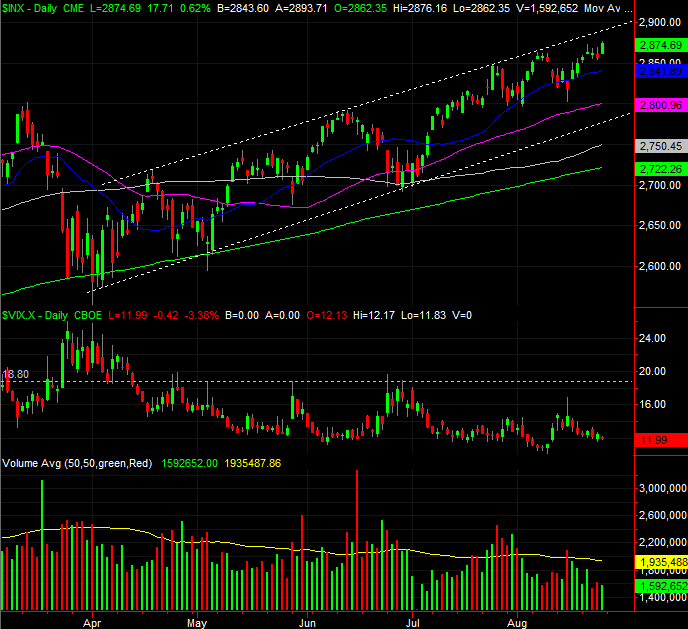
S&P 500 Daily Chart, with VIX and Volume
Source: TradeNavigator
The S&P 500 is now 5.2% higher than the 200-day moving average line (green), which isn't unheard of, but it is unusual. It's also not a situation that tends to last long. That's usually about the time we see a reversion to the mean.
Also not that while we saw a gain last week, the volume behind the move was the lowest-volume (excluding a holiday week) we've seen in a long while. It wasn't necessarily the majority opinion.
Zooming into a more detailed daily chart of the S&P 500, we can see that while the past few weeks have been decidedly bullish, the action is all within the confines of a rising trading range framed by white, dashed lines. The index is within one (maybe two) day's reach, so while the S&P 500 could continue on at this pace indefinitely, it's unlikely to accelerate from here.
S&P 500 Weekly Chart, with VIX and Volume
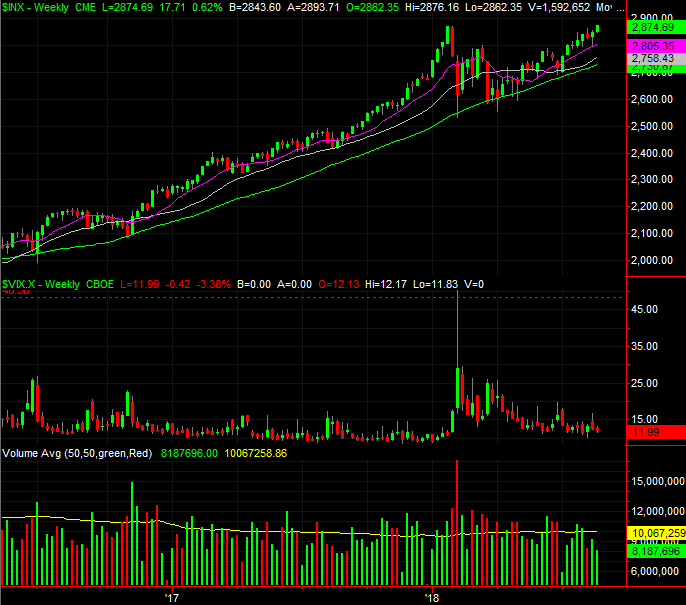
Source: TradeNavigator
Indeed, given how the amount of bullish volume continues to wane as the market inches higher, it's not out of line to assume the bottom will fall out soon.
The calendar suggests the same. We're almost to September - one of only two months that average a loss rather than a gain - and we're headed into September of this year more than a little ahead of bullish schedule.
The specifics: The average September sees the S&P 500 lose 0.64% of its value. Usually at the end of August, the index is up just a little less than 4.0%. Year-to-date though, the S&P 500 is up 7.5%, and as was noted above, the index is up 12% just since early April.
As was also noted above, it's a situation that forces one to trade on faith and assumption much more than it allows for conventional interpretation of the data... on the charts, and off of it. Given what we know right now though - and can see - the matter is mostly a coin toss. We have to assume the momentum will remain in place until we have a clear reversal in place. But, we also have to acknowledge that this underlying strength is unusual, and the market generally doesn't like to play host to unusual circumstances. The lack of bullish volume, again, is a red flag.
There are several lines in the sand that would indicate a correction is underway; most of them are moving average lines. There's no need to worry about a small dip turning into a big dip, though, until the 200-day moving average line (green) at 2722.26 fails to hold up as a floor. If the VIX breaks above its ceiling at 18.80, that's also a problem. Anything else is just more mere volatility.