Weekly Market Outlook - How a Losing Week Was Still a Winner
Stocks lost ground last week, bringing a raucous two-week surge to an end. But, even with the slight setback, a lack of a major selloff is a mini-victory in itself. The indices remain within striking distance of another advance, and managed to close above some key technical resistance as well. Best of all, sentiment measures suggest traders are... at least less nervous now (though still cautious, in a healthy way).
We'll look at what the market did and didn't manage to do last week below. First, let's run through last week's economic news and check out what's in store for this week.
Economic Data Analysis
Not too much to sift through from last week, though we did get a fair amount of real estate data. It could have been worse. Annualizes sales of existing homes slipped from 5.76 million to 5.27 million, and new home sales fell to a pace of 627,000, from 741,000. Interestingly, however, home prices -- the homes that are still being sold -- retained value. In fact, sale prices grew 0.7% for the month, topping expectations of a 0.5% increase.
Existing Home Sales and Case-Shiller Home Price Chart*
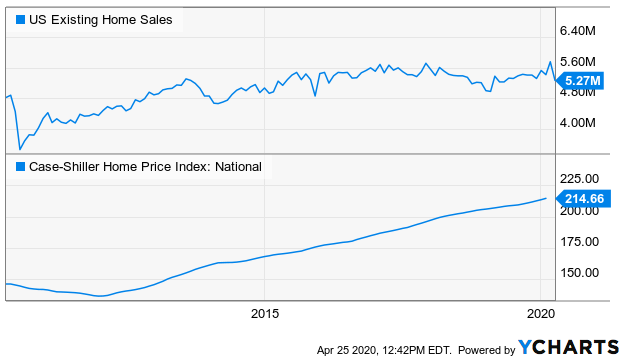
Source: YCharts
*Note the image reflects the Case-Shiller home price index and not the FHFA's measure of the same, though the two move in tandem.
The only other data set of interest last week was one we don't normally look at... durable orders. They're on our radar now only because the plunge was so significant. Total orders fell 14.4% last month. There's a major footnote that accompanies the data though. Not taking into account the change in orders due to always-volatile transportation orders, durable orders only fell 0.2% in March. Boeing's (BA) troubles alone made up a huge portion of those cancelled orders, although the coronavirus itself is making it difficult to make components or predict future transportation needs.
Durable Orders Charts
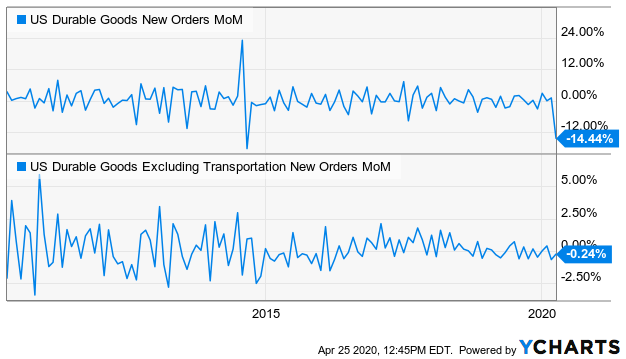
Source: YCharts
Everything else is on the grid.
Economic Calendar
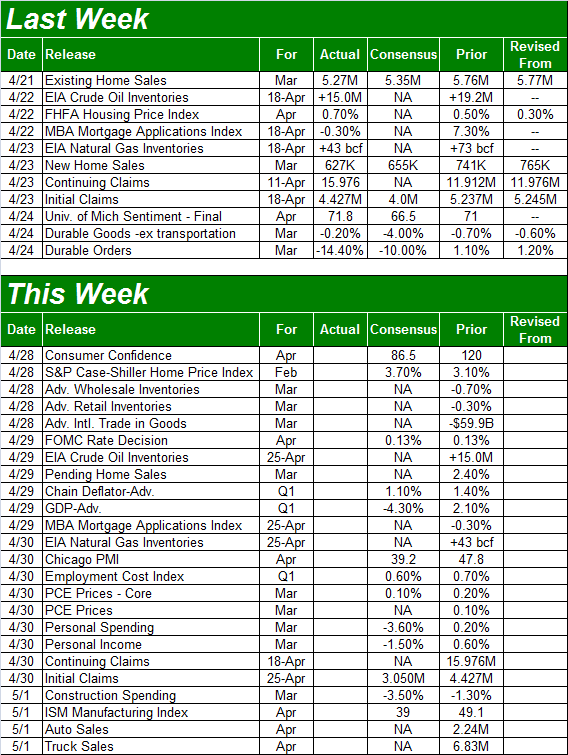
Source: Briefing.com
This week is going to be considerably busier, with the highlight coming in the middles of the week when the Federal Reserve has a chance to change interest rates. The Fed Funds Rate now stands between 0.0% and 0..25% (effectively 0.13%), and traders aren't betting it will be altered. Of course, there's little room for it to be pulled lower, and there's little upside to raising it in our current situation.
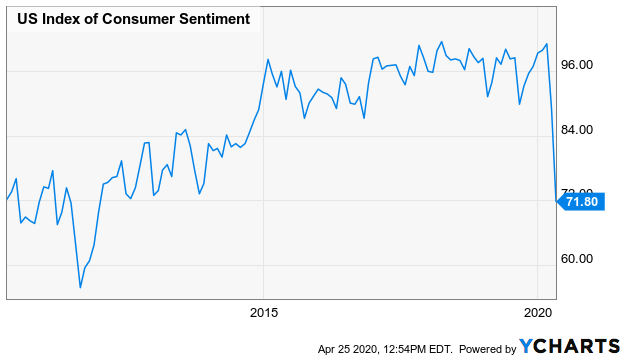
Other items of interest include the Conference Board's consumer confidence report on Tuesday. We got the third and final Michigan Sentiment Index figure for April last week. It fell to 71.8, from just a little less than 100, and economists expect the Conference Board's measure to plunge from 120 to 86.5.
Michigan Sentiment Index Chart
Source: YCharts
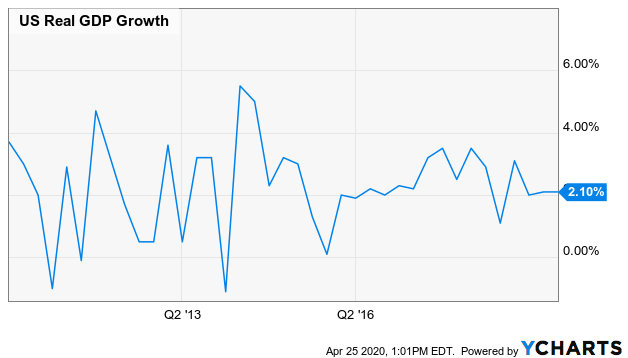
Also on Wednesday -- the same day the Fed will make the call on interest rates -- we'll also hear about the first quarter's GDP growth rate. It will be bad. The question is, how bad? The pros are expecting negative GDP growth of 4.3%, swinging from Q4's final tally of a positive 2.1%. But, they're only best-guesses in a very difficult environment.
GDP Growth Chart
Source: YCharts
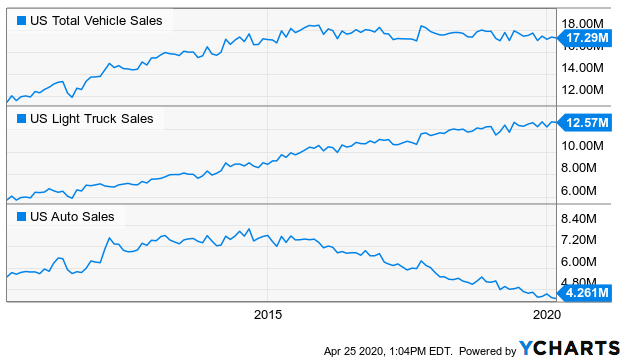
Finally, on Friday look for April's automobile sales reports. They fell quite a bit in March, though not as much as you might expect. They'll also likely fall again for this month, though again, there are hints that showrooms are still doing a fair amount of business. The catch? Deep discounts being offered by manufacturers to pull vehicles through the sales chain.
Automobile Sales Chart
Source: YCharts
Stock Market Index Analysis
Will they, or won't they? That's a question investors have been asking about bullish traders, who must lead the charge if stocks are going to hold up until the economy and earnings turn around. (Investors will follow traders, but traders aren't going to take a crazy chance not knowing what the future most likely holds though.) To their credit, there were just enough bulls to get stocks over a key hump before last week's trading came to a close. Unfortunately, the "umph" behind that move was minimal, at best. Then again, there's another piece of good news.
This is, of course, the reality of trading in the shadow of a coronavirus outbreak that may or may not be contained. Investors want to believe it is. Some are even trading like it is. But, with no clarity whatsoever as to when this thing will end, any stock-based bets right now are only slightly more educated guesses than coin tosses. On that note...
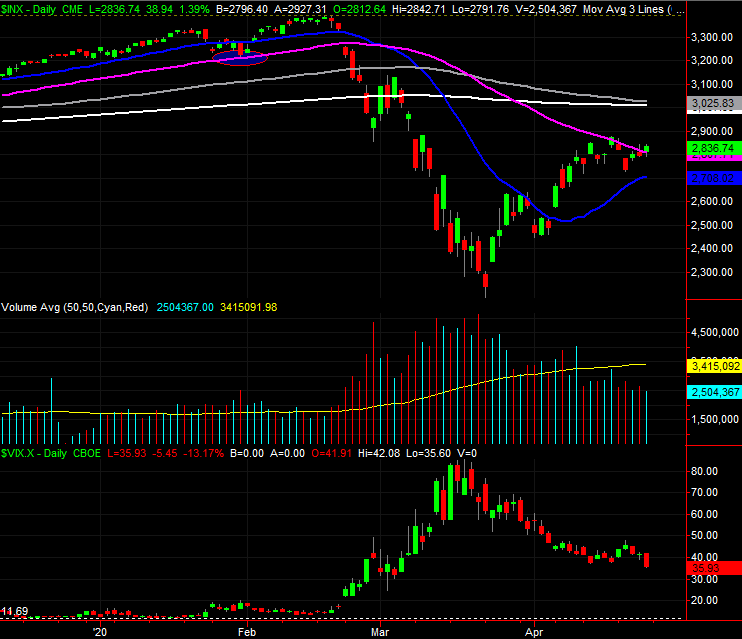
Last week's big victory was the S&P 500's close above the 50-day moving average line (purple). The flaw in that victory was the distinct lack of volume behind it. There aren't a great number of bulls right now. There are just fewer bears. Most people seem to be on the sidelines, waiting for the "other guy" to make the first move.
S&P 500 Daily Chart, with VIX and Volume
Source: TradeStation
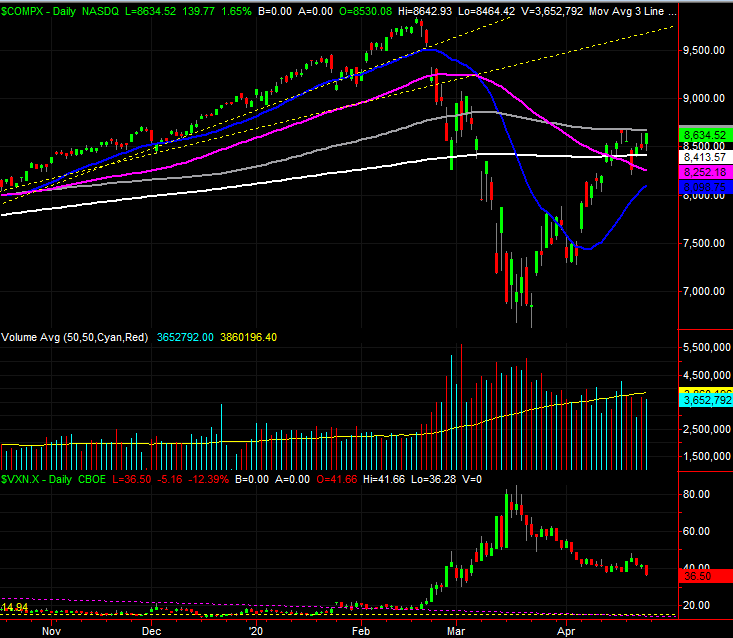
The same basic idea applies to the NASDAQ Composite, save one big difference. The composite is above its 50-day (purple) and 200-day (white) moving average lines, but is clearly struggling with the 100-day moving average line (gray) at 8669. We're just one good day away, however, from getting over that hump as well. Doing so could be catalytic.
NASDAQ Composite Daily Chart, with VXN
Source: TradeStation
There is one curious upside for both charts. In each case above, the volatility indices -- the VIX and the VXN -- renewed their downtrends last week in a pretty decided fashion. They may not be going "all in" with stocks, but through the VIX and VXN we can see smart money, hedge funds, and institutions are making slightly more bullish bets with options, or at least scaling back on their hedges against more bearishness. It's bullish, in its own way.
Zooming out to weekly charts of both indices gives us a little more perspective on what's happening right now, although it doesn't change the reality that stocks are still mostly beholden to headlines. More than anything though, the weekly view highlights a couple of key lines in the sand that we might have otherwise overlooked.
For the S&P 500, it's this timeframe that shows is the 100-day line (gray) is about to cross below the 200-day moving average line (white). The event itself isn't all that interesting, but where those lines cross could be a factor. That area, once the two intercept, could be a particularly tough technical ceiling. It looks like it's going to happen right around 3014.
S&P 500 Weekly Chart, with VIX and Volume
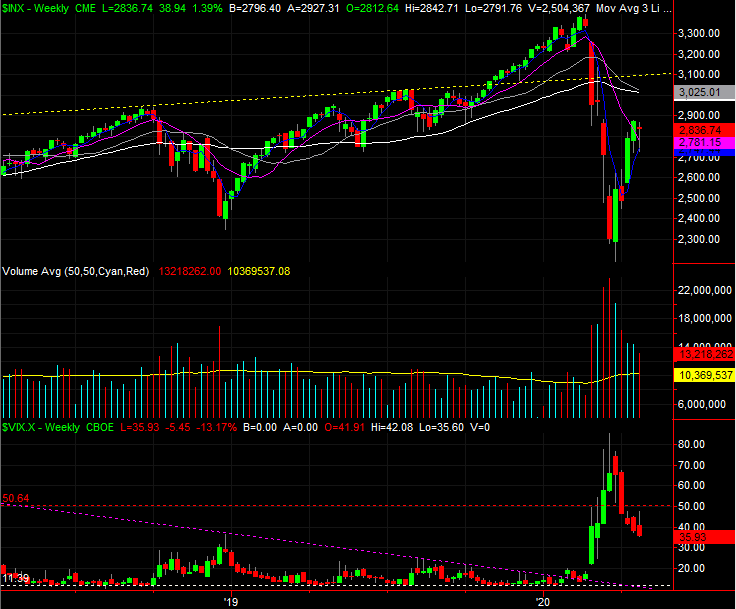
Source: TradeStation
The big highlight for the NASDAQ's weekly look is a little bit different. Here we can see the index has already been struggling with the 8630 area, which is a near-perfect 5/8 (61.8%) Fibonacci retracement of the entire February-March pullback. This is where one would expect to see some significant pushback.
NASDAQ Composite Weekly Chart, with VXN
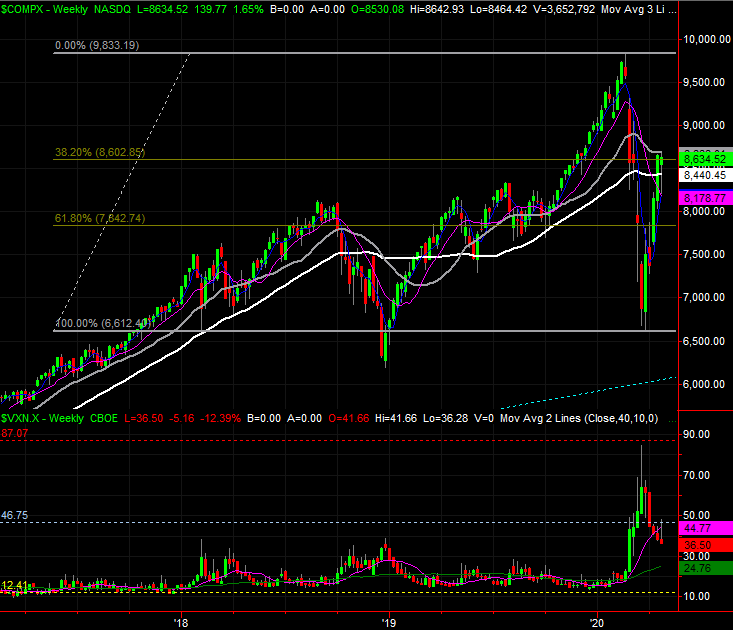
Source: TradeStation
The pause here isn't necessarily an indication that stocks are going to roll over. They might, but that's not the point. This is just the most opportune place for the bears to push back. The bulls could still keep fighting until they punch through. In some ways that would actually be a very bullish outcome. It would prove the advance can overcome adversity.
That may still not be the best thing in the long run, however.
We lamented last week that the market probably needed to suffer one more painful setback to truly "reset" and start a more sustainable rally. Not only had the sheer speed of the rebound left stocks vulnerable to a pullback, there were a handful of gaps left behind that needed to be filled in. Nothing's really changed in the meantime. The undertow may be slightly bullish now, and that may well be enough to get stocks all the way over their present hurdle and moving to higher highs. The need for a healthy correction would still stand though. It's just a matter of figuring out where it would start, and how deep it might cut.
More than anything else right now though, we just have to accept that COVID-19 is the big driving force. That means the undertow can change direction with little to no warning.