Weekly Market Outlook – Cracks Are Starting to Show

The market’s nine-week win streak firmly ended last week, with the S&P 500 tumbling 1.5%. That’s enough to start a setback, and there’s certainly plenty of room for more profit-taking from here. And yet, it’s still too soon to say the budding bull market is dead. It was due for a breather anyway.
The bigger worry here is something bigger-picture. That’s the lousy start to the new year. More often than not, when the first week of a new year is a lousy one, the rest of the year is similarly bearish.
We’ll look at that data and the market’s current situation in some detail in a moment. Let’s first run through last week’s top economic announcements and preview what’s in store for this week.
Economic Data Analysis
We didn’t get a whole lot last week. But, much of what we got was hard-hitting… and not all of it was bullish.
Take December’s ISM Services Index as an example. Economists were calling for a slight dip from November’s reading of 52.7, but the drop to 50.6 accelerates a long-standing downtrend. The tumble also puts the index dangerously close to the 50 mark, which separates growth from contraction. We’re moving the wrong direction.
The ISM Manufacturing isn’t. It bolted a bit higher last month, topping expectations as well as underscoring some recent success in its effort to reverse higher again. It’s not quite in a new uptrend yet, however.
ISM Manufacturing, Service Index Charts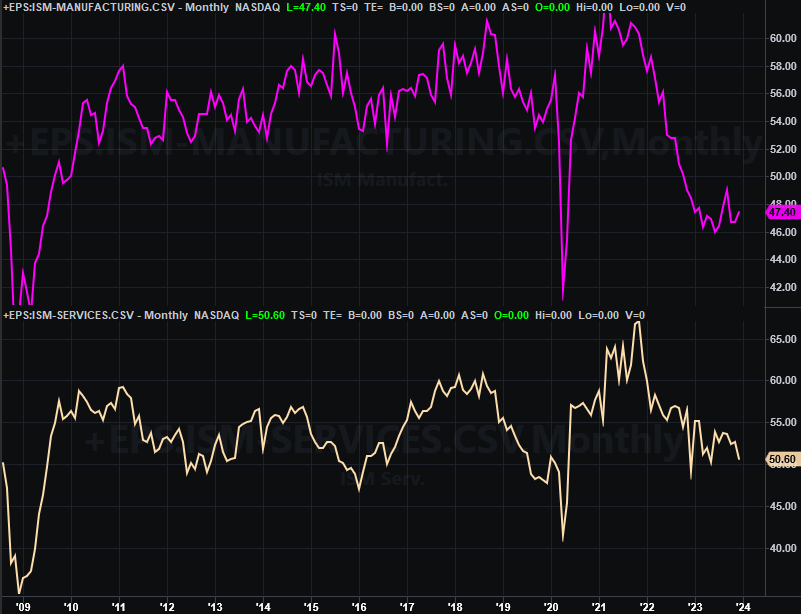
Source: Institute of Supply Management, TradeStation
The only other major economic news delivered last week was December’s jobs report. Payroll growth of 216,000 jobs was much better than the forecasted 170,000, and improving on the previous month’s pace of 173,000. That was strong enough, in fact, to keep the unemployment rate at 3.7% rather than allowing it to tick up to the expected 3.8%. Wage growth -- while good -- wasn’t quite as robust as expected.
Payroll Growth, Unemployment Rate Charts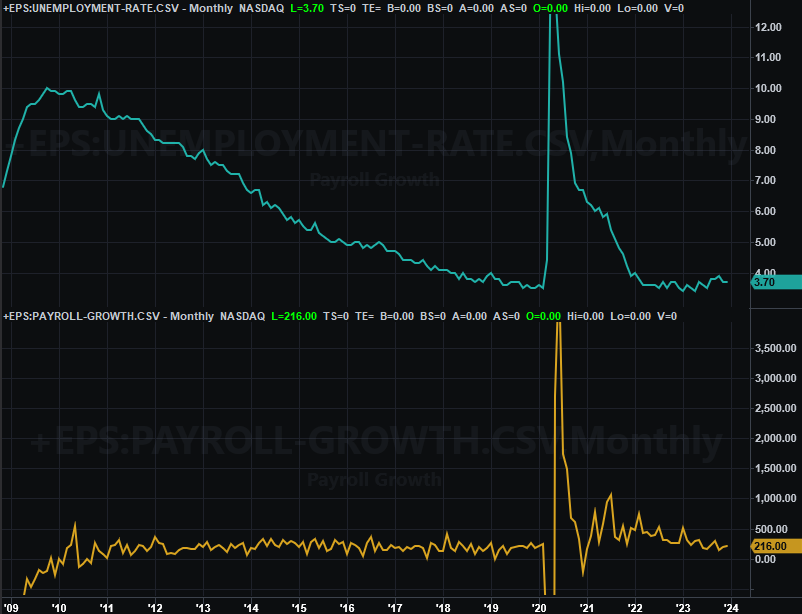
Source: U.S. Bureau of Labor Statistics, TradeStation
Everything else is on the grid.
Economic Calendar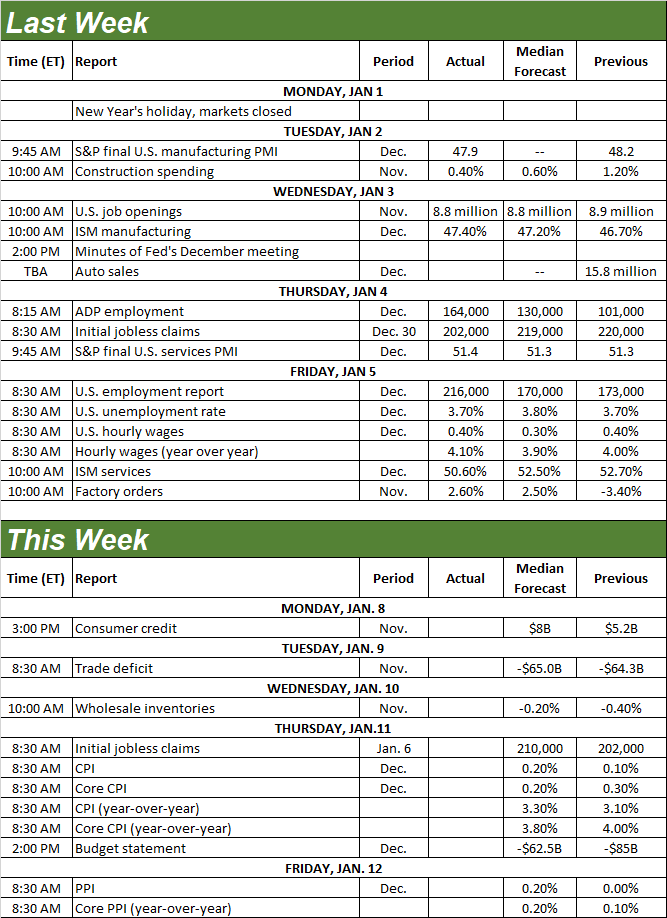
Source: Briefing.com
We’re not getting a whole lot of data this week, but we are getting an important batch of related data. That’s December’s inflation figures. Consumer inflation numbers will be dropped on Thursday, with producer inflation data due on Friday. Overall, forecasters believe prices ticked higher at a slightly faster pace than they did in November, calling into question hopes that the Fed is ready to dial back interest rates in the foreseeable future.
Inflation Rate Charts (Annualized)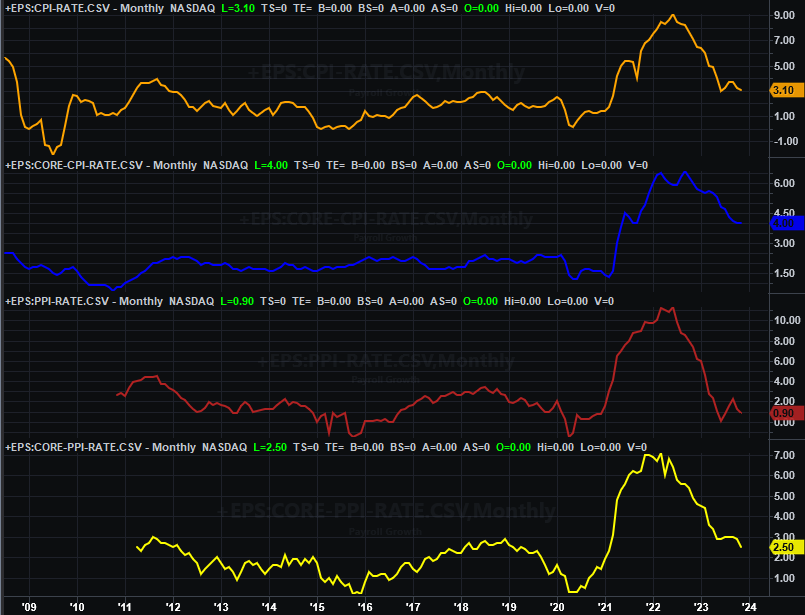
Source: U.S. Bureau of Labor Statistics, TradeStation
Just for the record though, inflation data isn’t the Federal Reserve’s top driver of interest rate changes. It’s important to be sure. But, the FOMC actually keeps closer tabs on a consumer income and consumer expenditures when it comes to making decisions on interest rates.
Still, this week’s numbers are a factor on that front.
Stock Market Index Analysis
This week we begin with a close-up look at the daily chart of the S&P 500. It speaks volumes. The most important feature? For the first time since early November the index is below its 20-day moving average line (blue) at 4,718. This is game-changing… at least in the near-term.
S&P 500 Daily Chart, with VIX and Volume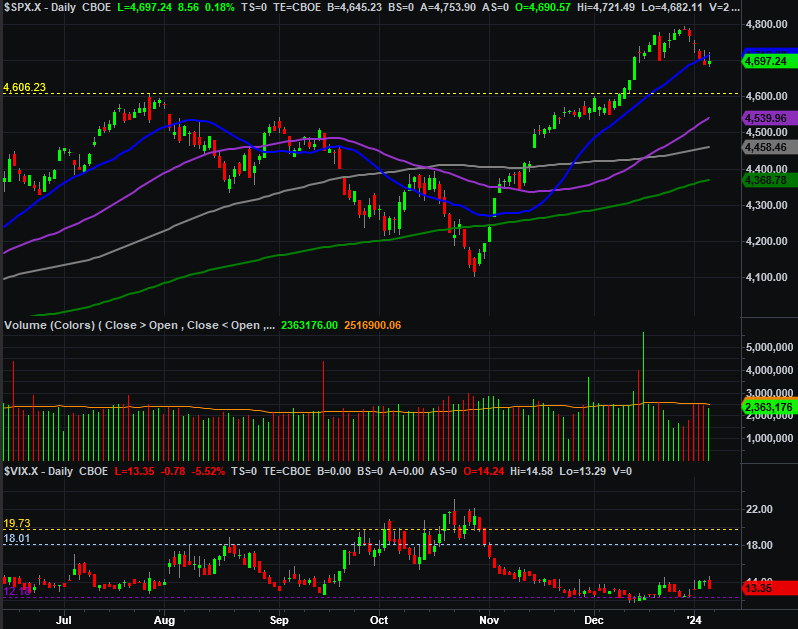
Source: TradeNavigator
The NASDAQ Composite did the exact same thing, although there’s one added detail worth pointing out of the composite. That is, the NASDAQ seems to be finding support at the technical ceiling right around, 14,440. This isn’t unusual. In fact, it can be somewhat expected. It’s also a decent glimmer of hope that whatever selling we were due has run its course.
NASDAQ Composite Daily Chart, with VXN and Volume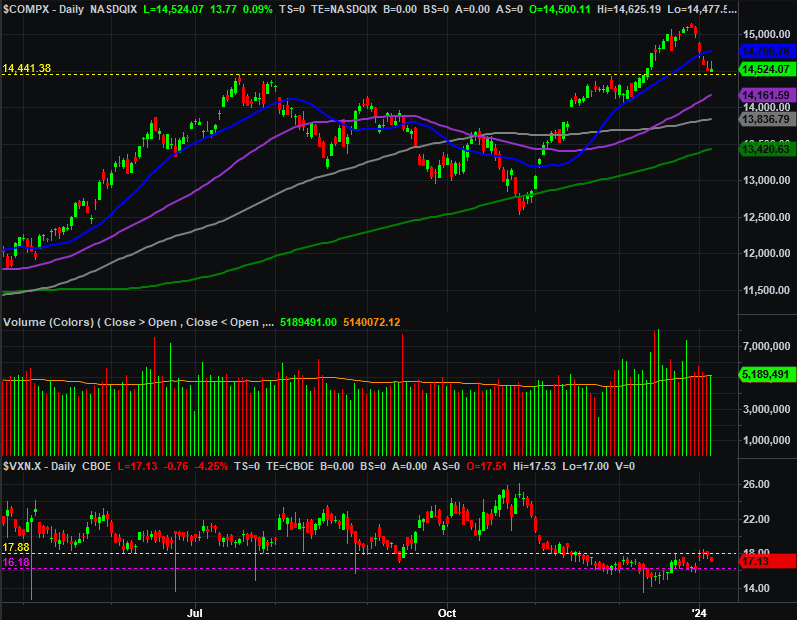
Source: TradeNavigator
Backing out to a weekly chart puts things in a little more perspective. Take a look at the weekly chart of the S&P 500, for instance. In this timeframe (showing over two years’ worth of data) we also have to wonder if the recent approach toward the late-2021 high near 4,810 has something to do with the peak from two weeks ago and last week’s 1.5% tumble. The weekly chart also shows us just how big of a gain the index had made over the course of the prior nine weeks. It was too much, too fast. Even if not the beginning of a new bear market, most of the recent rapid runups have been met with more bearish pushback than we’ve seen thus far.
S&P 500 Weekly Chart, with VIX and Volume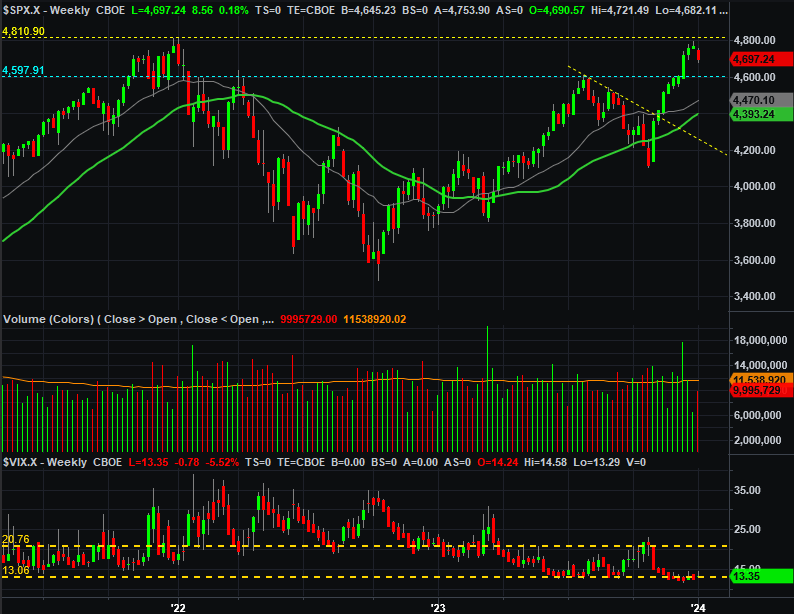
Source: TradeNavigator
With all of that being said, this bearish start to the new year is nothing to simply dismiss. On average, the year that starts in the red tends to end that same year even deeper in the red.
Average Year (Day-by-Day) for S&P 500 (Bearish vs. Bullish vs. Average)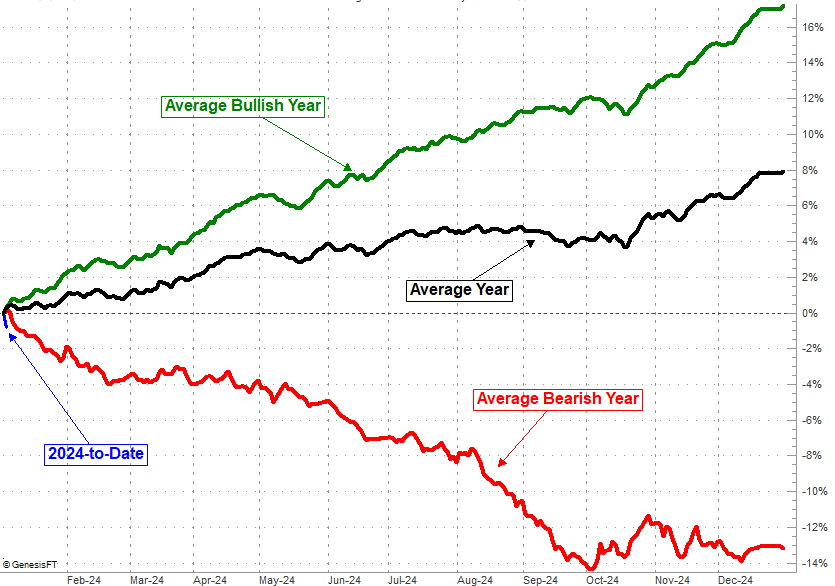
Source: TradeNavigator
This premise should be considered with a sizeable grain of salt. Most full-year losses are losses because we’re in bear markets at that time. It’s just that the calendar-based correlation is quite consistent. Bullish years reliably tend to start on a bullish foot. Bearish years reliably tend to start on a bearish foot.
In the current case the overarching problem with such a bearish argument is that the only real bearish clue we can point to the fact that the indexes both broke under their 20-day moving average lines. No other technical support levels have been breached, and the overall uptrend remains technically intact. Not even the volatility indexes that have been “too low” for some time have yet to start making a clear, new uptrend. To this end, know that the S&P 500’s Volatility Index’s (VIX) most important resistance level right now is right around 14.5, where it’s topped out a few times since mid-November. A move above that mark could be something worth noting, presuming the S&P 500 itself also starts breaking under its other, more important technical floors. Ditto for the NASDAQ Composite.
Bottom line? This isn’t a time to start plowing into new trades. But, it’s also not a time to panic and start dumping longer-term positions either. We knew this setback was not only possible, but likely to take shape sooner than later. Let’s see how the bulls handle this first real test in a while… the move under 20-day moving average lines.