Weekly Market Outlook – Cracks Are Starting to Show, But the Rally Remains Intact

Stocks suffered a loss last week… the biggest one in a while, in fact. Perhaps worse, the move shattered what had become a pretty impressive technical support level.
There’s still a decent chance, however, the market could bounce back into bullish form without moving lower first. It’s just that we’re very, very close to reaching the point where that feat become very difficult to achieve.
We’ll look at how close we are to that cliff in a moment. Let’s first run through last week’s biggest economic reports, which included a surprisingly good jobs report for March.
Economic Data Analysis
There were only two biggies last week. The first of these was Monday’s manufacturing index from the Institute of Supply Management (ISM) followed by Wednesday’s ISM services index update. Manufacturing activity was up even more than expected, continuing to build on the rebound from the 2022/2023 lull. Services activity, however, continued to wane… although both measures are still above the pivotal 50 level.
ISM Services and Manufacturing Index Charts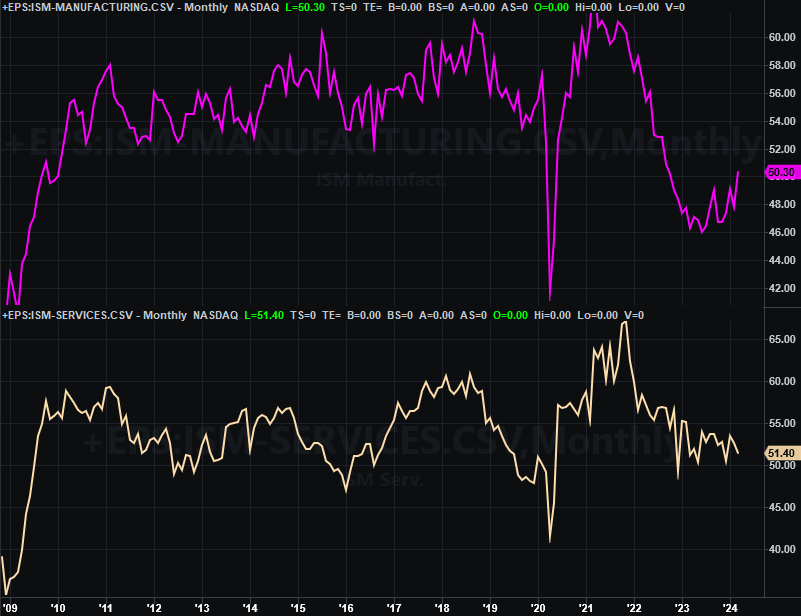
Source: Institute of Supply Management, TradeStation
It’s not clear how long these two data points’ directions can diverge. But, it can’t go on like this forever. It’s a mixed message until one of the ISM numbers starts agreeing with the other.
The other big item from last week is of course March’s jobs report posted on Friday. It was a win to be sure. Payroll growth of 303,000 jobs topped expectations of 200,000, accelerating February’s figure of 270,000. That was enough to pull the unemployment rate down from the previous month’s 3.9%.
Unemployment Rate and Payroll Growth Charts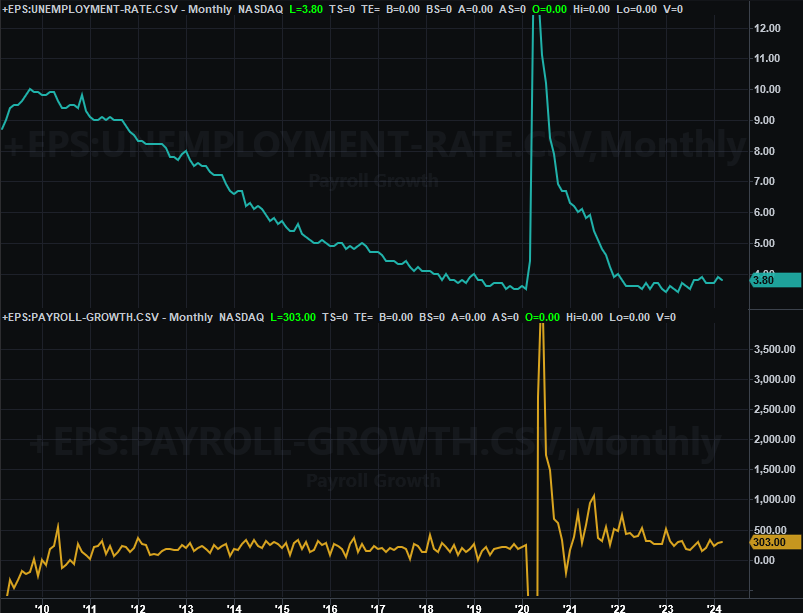
Source: Bureau of Labor Statistics, TradeStation
Just keep the fine print in mind. That is, the biggest single source of job creation is the government; private payroll growth is still slowing down. The employment/population ratio is actually dwindling, yet the number of people with more than one job continues to rise. Layoffs and discharges are also on the rise. This job growth doesn’t tell the entire story, although it is at least net-positive.
Everything is on the grid.
Economic Calendar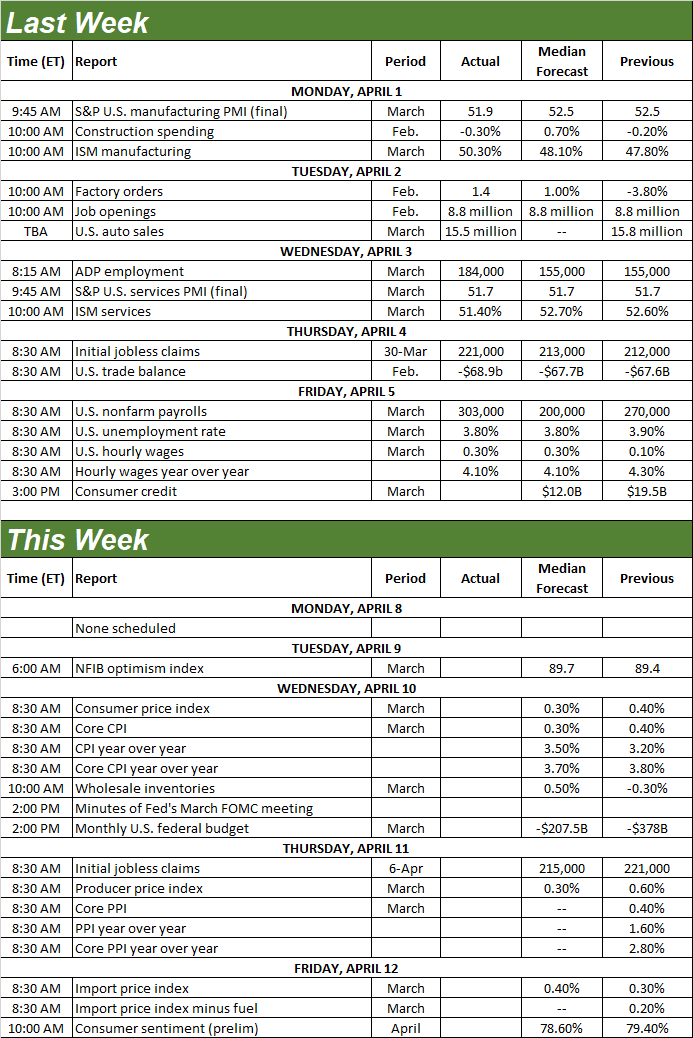
Source: Briefing.com
This week is another big one, albeit for a singular reason. That’s inflation, and the impact it’s apt to have on interest rates. Consumer inflation figures for March will be posted on Wednesday morning, followed by the release of the minutes from the most recent meeting of the Federal Reserve’s governors. On Thursday, look for producer inflation data. Unfortunantely, all of it is expected to hold near their currently-above-goal levels. This crimps the likelihood of interest rate cuts anytime soon (although it’s worth noting that these numbers aren’t the data the Fed’s most concerned about when making rate decisions -- that’s consumer spending and personal income data).
Inflation Rate Charts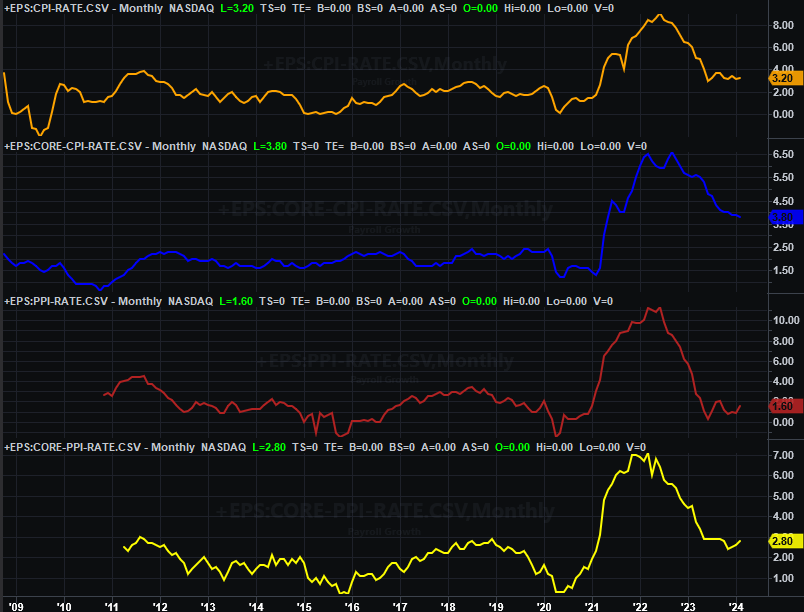
Source: Bureau of Labor Statistics TradeStation
To this end, know that traders aren’t counting on a rate cut until mid-June at the earliest, and even then there’s only a 50/50 chance we’ll see a quarter-point cut. That’s also the last quarter-point cut investors expect to see until September (and there’s only a modest chance we’ll see another one then).
Stock Market Index Analysis
Last week’s stumble wasn’t just a stumble. With its 0.8% pullback, the S&P 500 broke under a couple of key technical support lines. it managed to crawl back above one of them thanks to Friday’s rebound effort. But, the damage is done… mostly. One or two more bad days and stocks will be past the tipping point.
Take a look at the daily chart of the S&P 500 below. For the first time in weeks the index broke below its 20-day moving average line (blue). And, it also managed to pull below the straight-line support (purple, dashed) that’s also been steering the S&P 500 upward since January. The index was able to fight its way back above the 20-day line on Friday, but as you can see it’s still below the straight-line technical floor. This changes things enough to at least be a bit worried.
S&P 500 Daily Chart, with VIX and Volume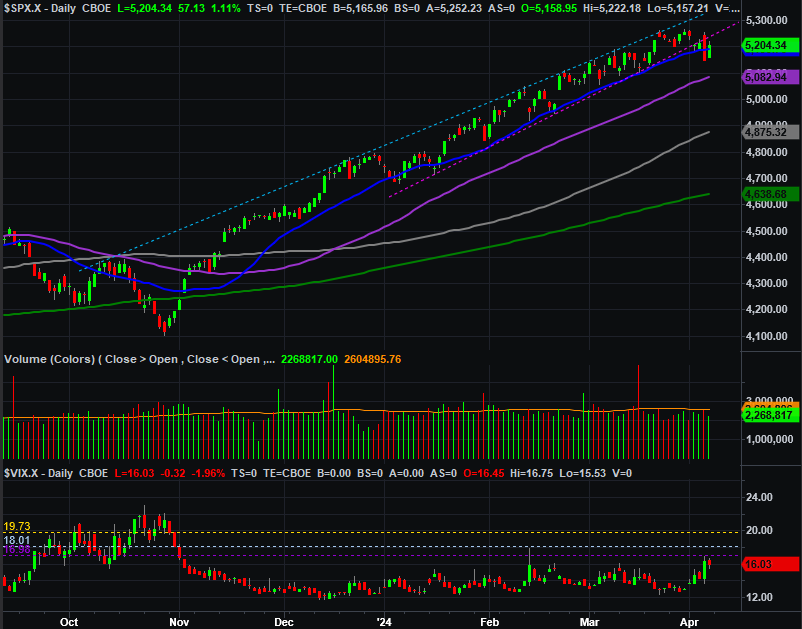
Source: TradeNavigator
The NASDAQ Composite looks pretty similar. It took broke under its straight-line support (light blue, dashed) that connects all the key lows since January. And, it also pulled under its 20-day moving average line (blue) and even came close to testing the 50-day moving average line (purple) as a floor for the first time since the middle of last year. Like the S&P 500, this changes a lot. We’re now seeing things -- bearish things -- we haven’t seen in a while.
NASDAQ Composite Daily Chart, with VXN and Volume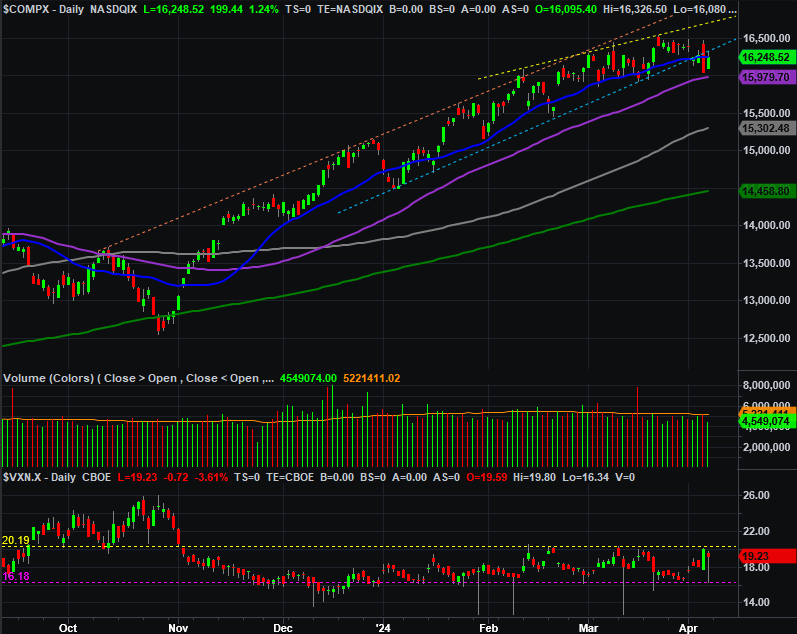
Source: TradeNavigator
There’s something else that’s even more noteworthy about the S&P 500’s as well as the NASDAQ’s daily charts, however. That’s both index’s volatility indexes… the VIX, and the VXN. The S&P 500’s VIX is testing a technical ceiling around 17 (purple, dashed), while the NASDAQ’s VXN is testing a major resistance line (yellow, dashed) at 20.2. If either of those ceilings are broken at the same time either the S&P 500 or the NASDAQ break under their aforementioned technical floor, it could open the floodgates.
That’s unusual for this time of year. April and May (and June) tend to be pretty good months for the market. But, the past few months have been unusually bullish. There’s certainly room for some profit-taking here.
S&P 500 Average Yearly Performance, Day-to-Day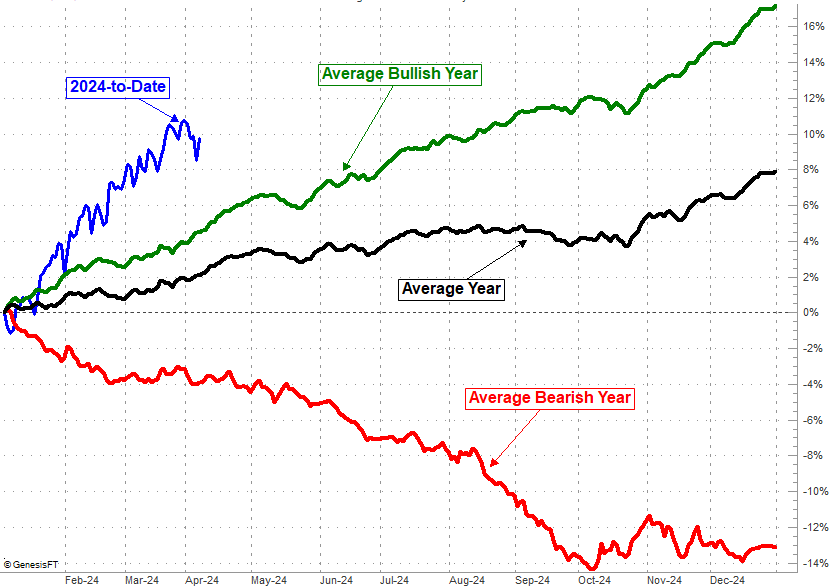
Source: TradeNavigator
And the weekly chart of the S&P 500 puts this possibility in perspective. The index has truly soared since October’s bottom, up nearly 29% from that point. That’s a lot of ground to cover in such a short period of time… too much, really. There’s a good case to be made that we’re due for a bit of profit-taking.
S&P 500 Weekly Chart, with VIX and Volume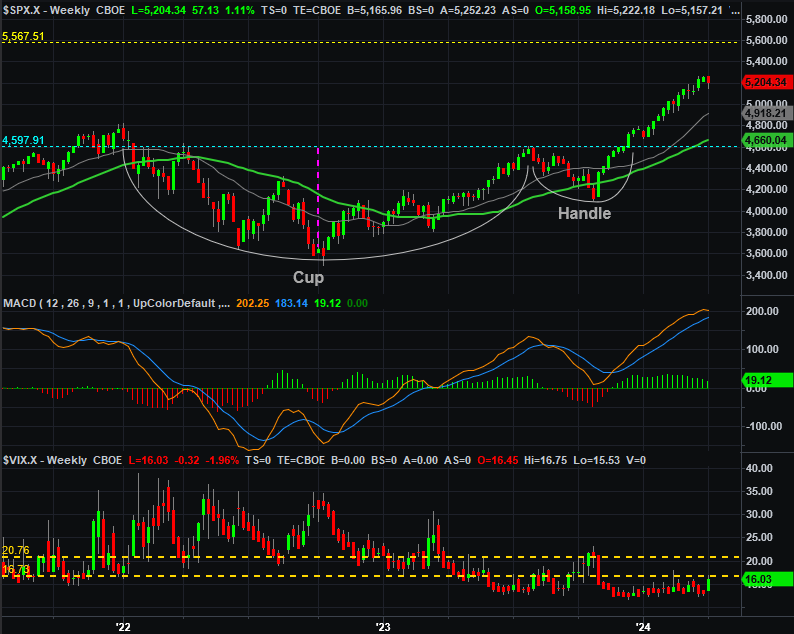
Source: TradeNavigator
It’s still too soon to assume the worst. But, it’s certainly not too soon to prepare for the worst. As was noted above, last week’s tumble was a tough technical blow. Another lower low might be more than the market can recover from with ease. That might force stocks to go all the way through a full-blown correction before finally being able to start rallying again. The VIX and the VXN will be additional clues to that prospect.
Just don’t jump the gun. There’s still a smidgen of hope the market could rekindle its bigger-picture rally from here.