Weekly Market Outlook – Another Week, Another Win. But, This Is Where Things Get Tough

The Thanksgiving holiday may have kept market activity to a minimum this past week. But, as is usually the case, what little action there was this week leaned in a bullish direction. The S&P 500 closed about 1% higher for the full week on Friday, marking the fourth consecutive week of gains.
While the tide may still be moving in the “right” direction, there’s an important nuance worth pointing out. That is, the rally is most definitely slowing down. It’s also slowing down as well-established technical ceilings move into sight, as could have been expected. We may yet see one stumble before moving into the usual year-end bullishness.
Or, maybe we won’t.
Whatever’s in the cards, we’ll take a look at where things are and what’s apt to be next in a moment. Let’s first examine last week’s economic news and preview the reports that are in the lineup for this week.
Economic Data Analysis
There wasn’t much data posted last week, but we did hear October’s sales of existing homes. As was expected, they fell, although they fell much more than expected. The annualized pace slipped from September’s reading of 3.95 million to a multi-year low of 3.79, versus an outlook of 3.9 million.
Home Sales Charts
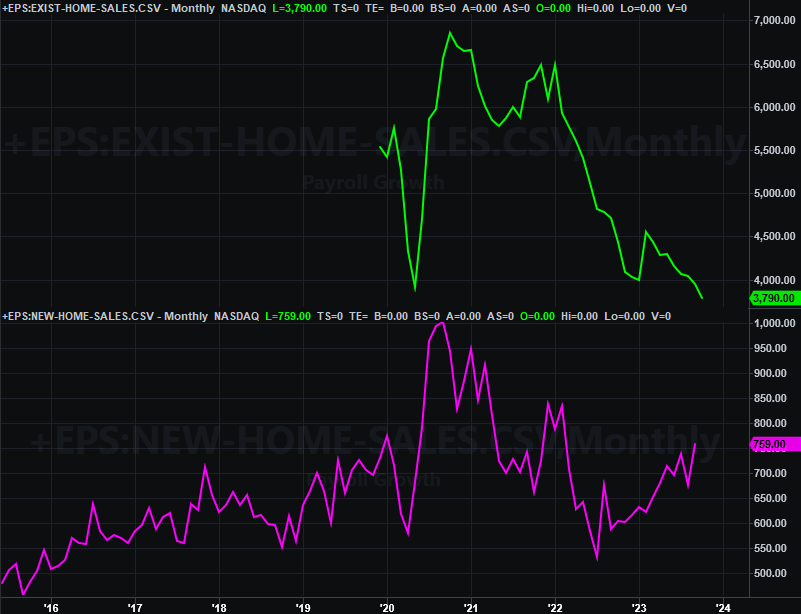
Source: National Association of Realtors, Census Bureau, TradeStation
Some of this weakness can be chalked up to higher interest rates and uncomfortably high prices. Much of it is also attributed to the fact that people are simply staying in their homes. While available inventory grew to a multi-month high supply of 1.15 million homes, that’s still well below the pre-pandemic peak of around 2 million.
This weakness in the existing home market, though, is being well offset by activity in the new-home market. September’s sales reading of 759,000 newly-built homes is the best reading in nearly a couple of years. Economists believe that figure will fall when October’s data is posted on Monday of this week. Even so, the bigger trend is pointed upward.
Consumer sentiment continues to crumble too. November’s University of Michigan sentiment index was updated on Wednesday, rolling in at 63.8 for the month. That’s the third straight month sentiment has slipped, mirroring the weakness seen with the Conference Board’s consumer confidence index.
Consumer Sentiment Charts
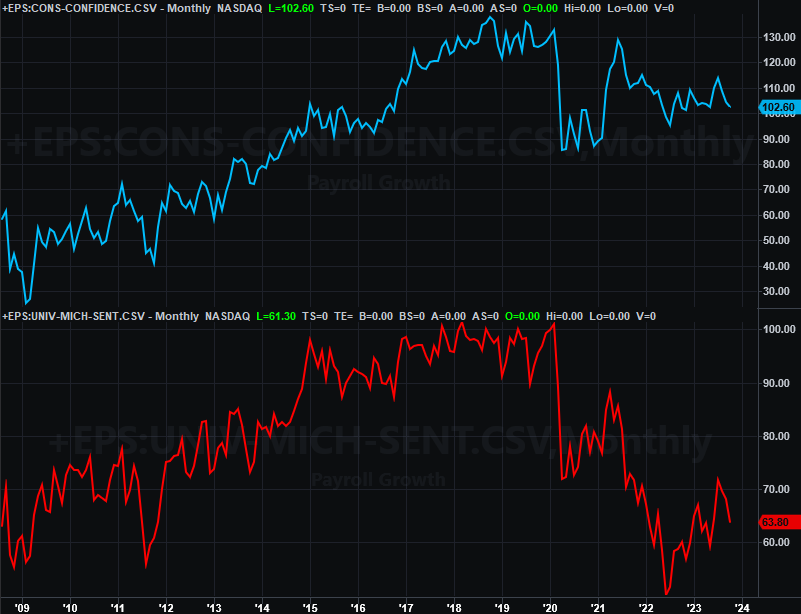
Source: Conference Board, University of Michigan, TradeStation
Note that the Conference Board’s number will be updated on Tuesday of this week, although forecasts suggest nothing about the bigger trend is likely to change.
Everything else is on the grid.
Economic Calendar
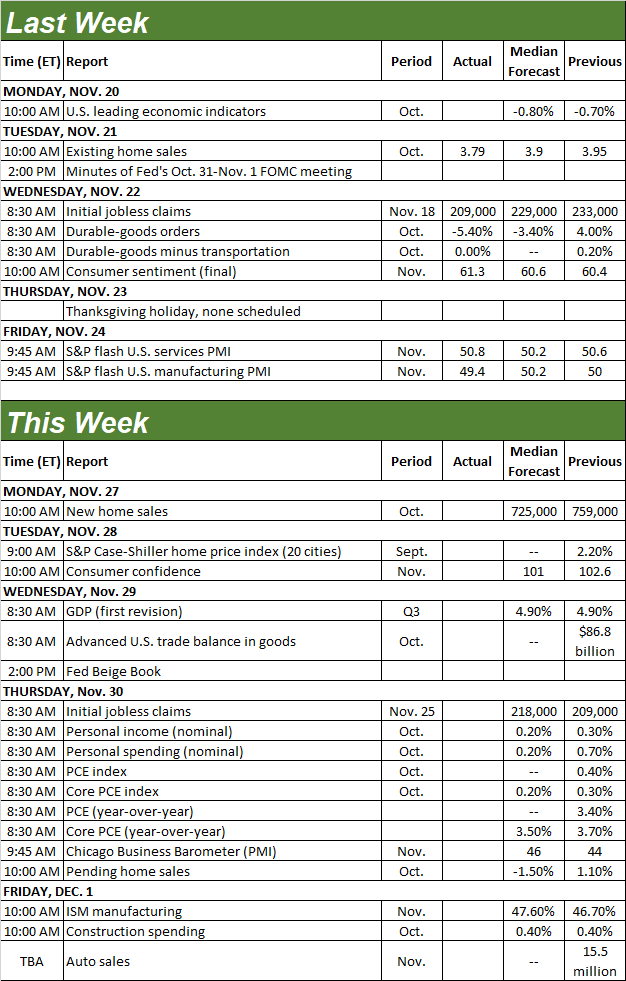
Source: Briefing.com
The Conference Board’s release of November’s consumer confidence score isn’t the only report slated for Tuesday. We’ll also get September’s Case-Shiller Index update as well as a refreshed FHFA home price index report that day. Both have been on the rise of late despite the wobbly economic backdrop, largely reflecting a lack of supply rather than raging demand… which gives the few sellers that are selling homes lots of pricing power. Look for this strength to have persisted for at least one more month.
Home Price Charts
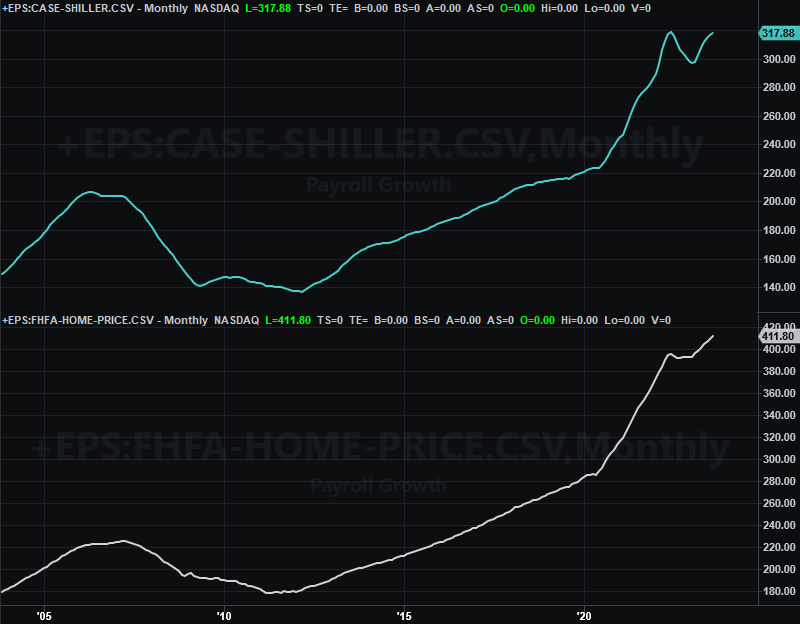
Source: FHFA, Standard & Poor’s, TradeStation
Although we’re not charting it here, also note that the first estimate of Q3’s GDP growth rate will be posted on Wednesday. Economists are calling for tremendous growth of 4.9%. Just bear in mind that’s a comparison to a rather weak quarter. Even a slight shortcoming of this figure could prove problematic for the market.
On Thursday we’ll get a swatch of economic reports regarding peoples’ spending and income. Again, we’re not charting it here, but do know these are the numbers the Federal Reserve likely pays more attention to than any other when it comes to raising or lowering the Fed Funds rate. Forecasters say income and spending should roll in down just a bit for October, but only just a bit.
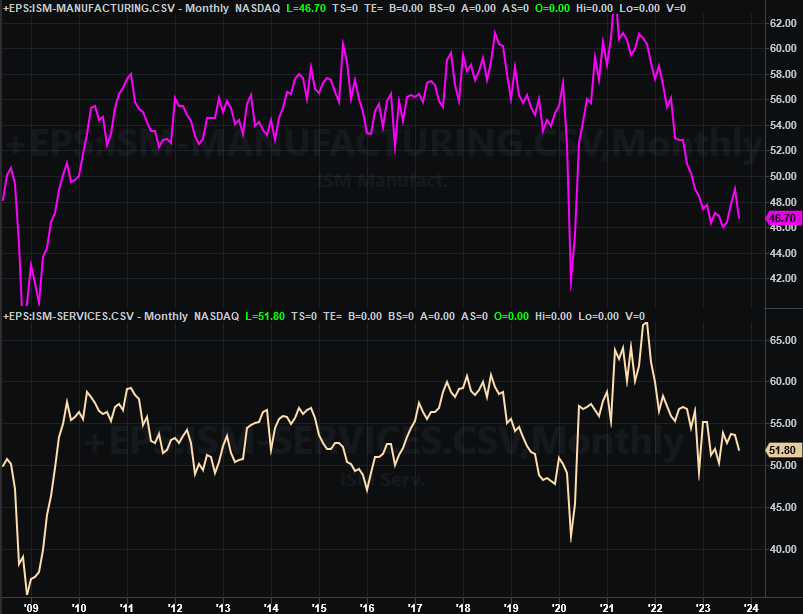
Last but not least, on Friday we begin hearing from the Institute of Supply Management about its economic barometers. Friday’s report looks at the nation’s manufacturing industry. Economists are calling for a slight improvement, but even then the number will likely remain below the pivotal 50 level.
ISM Services, Index Charts
Source: FHFA, Standard & Poor’s, TradeStation
The ISM Services Index for October will be released next week. Notice that while this measure is holding above 50, it’s also in an obvious downtrend.
Stock Market Index Analysis
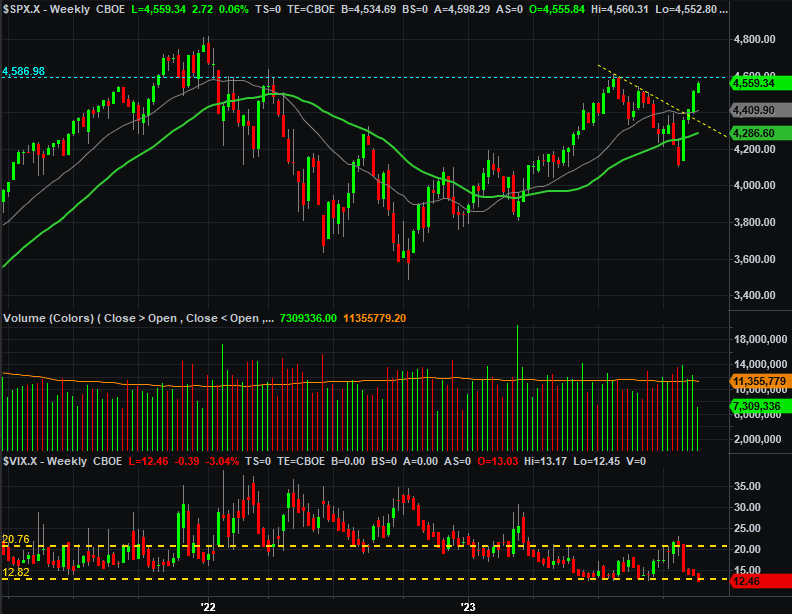
We kick things off this week with a look at the weekly chart of the S&P 500 because it’s important to understand the bigger picture first. As this chart shows, the pace of the market’s progress continues to slow down. As this chart also show us, the S&P 500’s rally is starting to slow down as a major resistance line is moving into view. That’s the 4587 level, where the index peaked in July but also where is found resistance back in early 2022.
S&P 500 Weekly Chart, with VIX and Volume
Source: TradeNavigator
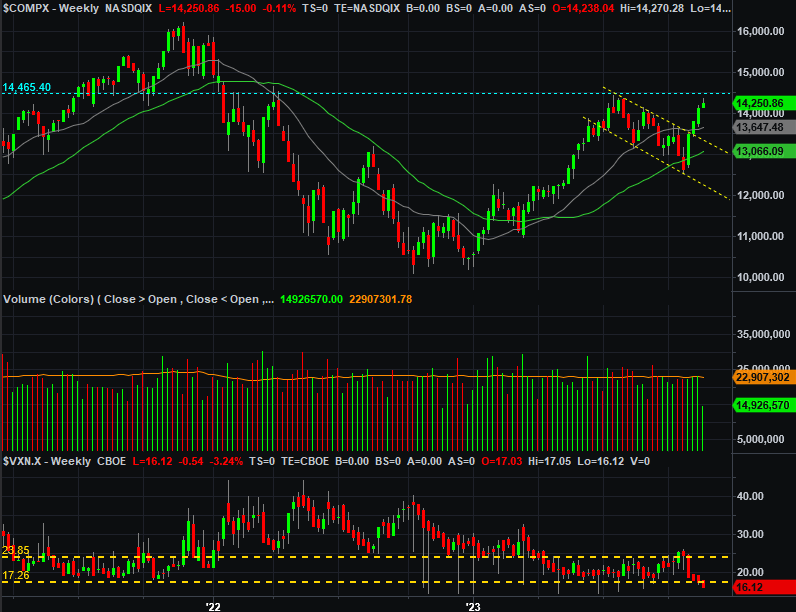
The NASDAQ Composite looks quite similar. That is, the index is also slowing down as it approaches July’s peak, and the ceiling at 14,465 that was a bit of trouble early last year.
NASDAQ Composite Weekly Chart, with VXN and Volume
Source: TradeNavigator
It’s important to note that last week’s lethargy may be at least partially attributable to the holiday, which tends to crimp interest in trading. That’s also likely why the VIX and the VXN both slipped to oddly low levels; a lack of trading interest deflates the premiums traders are willing to pay that keep the VIX and VXN values propped up.
Still, we start this week where we left off last week. That’s with volatility indexes that are very, very low, and two stock indexes that are just below well-established technical ceilings. That’s going to work against the market. The question is, will it be enough to actually (and finally) pull stocks down again? We don’t know.
What we do know us where any pullback should stop if-and-when one starts.
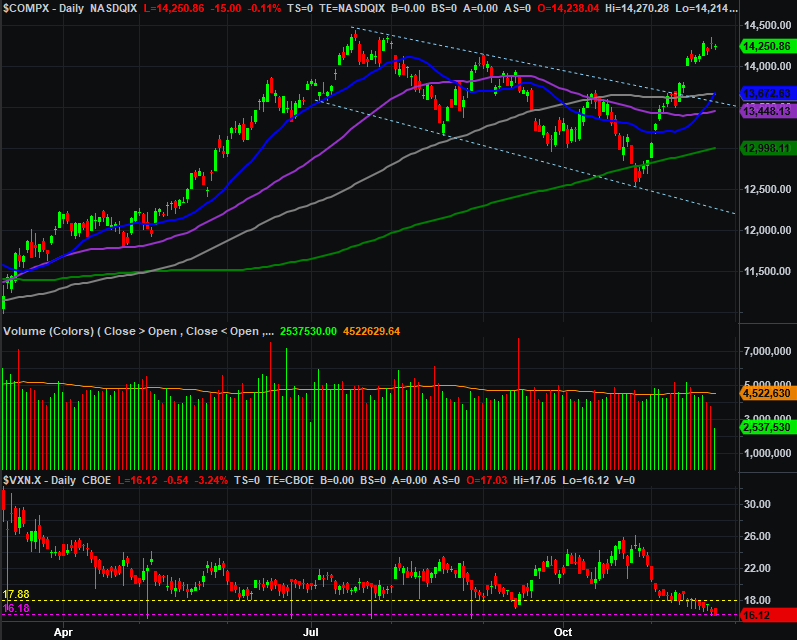
For the NASDAQ Composite, that’s somewhere around the 13,670 mark, where the 20-day moving average line (blue) just hurdled its 100-day line (gray), as you can see on the daily chart below.
NASDAQ Composite Daily Chart, with VXN and Volume
Source: TradeNavigator
The S&P 500’s equivalent floor is 4,409, where its 20-day and 100-day moving average lines are about to do the same. That’s also near where the index was briefly bumping into a ceiling in October as well as early November. There’s something about that level worth watching.
S&P 500 Daily Chart, with VIX and Volume
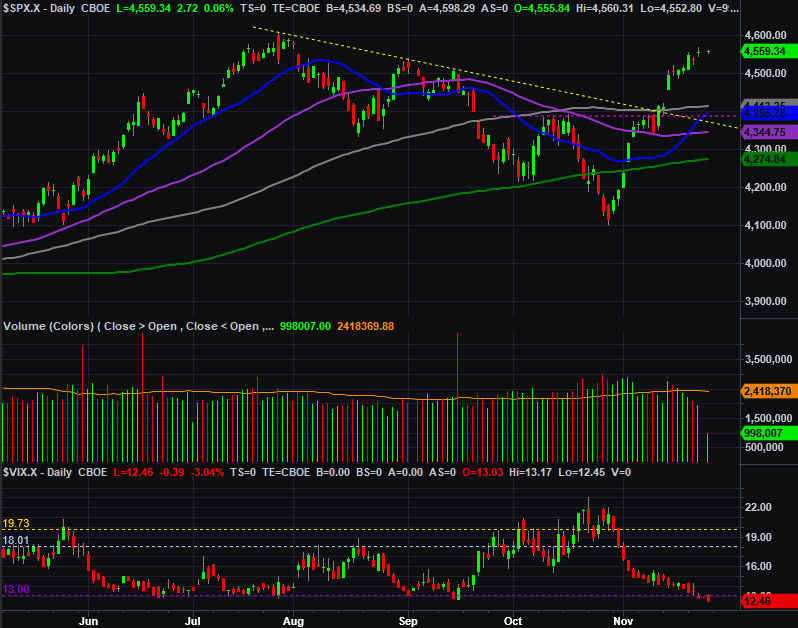
Source: TradeNavigator
The funny thing is, such a dip might be the very best thing that could happen to the market at this time. The past four weeks have been wildly bullish, leaving little room for the usual year-end gains. A slide of around 3% to 4% would cool things off just enough, and give the bulls some time to regroup and then rekindle the bigger-picture effort.
Unfortunately, there’s no guarantee that’s what’s in the cards. If stocks start soaring again out of the gate this week, that most definitely confuses the issue.
Just don’t be too stubborn about the matter. The rally from last October’s low to July’s high was also unlikely, but kept charging anyway. It only took slight pullback to the 20-day and 50-day moving average lines to spark the next wave of buying. That’s just the sort of rally you need to keep on a short leash, understanding that things are just one bad day away from starting a meltdown like we say between July’s high and this October’s low.